Counter-Strike has always been one of my favorite games. In fact, it played a pretty big role in how I first became interested in coding and reverse engineering.
It’s been a long time since I played Counter-Strike, but recently I got curious about how things have changed under the hood, especially with new version of Counter-Strike 2 and the current state of VAC. This time it was client.dll from Counter-Strike 2.
People talk about VAC like it is some mysterious black box but really it is just a DLL that sits inside the game process and collects data for Valve servers. This is basically me revisiting an old favorite game through the thing it originally helped get me interested in.
This is not a full analysis. I did not run the game or capture network traffic. I just loaded the DLL into IDA and wrote down what I found. Some things I am confident about. Some things are my best guess. I will say which is which.
The Big Picture
Before we look at any code you need to understand how VAC is structured. It is not one thing. It is three separate components that work together like layers of an onion.
Layer 1: Trusted Launch (inside cs2.exe)
This runs before the game even starts. cs2.exe loads 4 signature catalogs using CryptCatAdminAcquireContext2. These catalogs are like a whitelist of approved DLLs. Then it hooks NtOpenFile. Any time something tries to open a file with read+execute access, the hook checks if the file has a valid signature. If it does not, Windows returns STATUS_OBJECT_NAME_NOT_FOUND as if the file does not exist.
Launch flags matter here. If you use -insecure this whole thing is skipped. If you use -trusted it requires full catalog verification.
Layer 2: The External Scanner (inside steam.exe)
Steam itself reads cs2.exe memory from outside the process. It only uses two system calls: NtReadVirtualMemory (reads memory) and NtQueryVirtualMemory (queries memory regions). It opens 4 separate handles to cs2.exe so it can cross verify reads. There is no kernel driver. This is pure user mode.
Layer 3: The In Process Scanner (inside client.dll)
This is what I spent my time on. client.dll is loaded into the game and it has all the scan logic. It hashes your DLLs, checks vtables, catches hardware breakpoints, and sends reports to Valve servers. The server can also send commands back telling it to do things like read memory or probe functions. I focused on the in process scanner inside client.dll because that is what I had in IDA.
First Look in IDA
When you load client.dll into IDA the first thing you notice is the size. Over 4000 functions. 933 imports across 8 different modules. Around 1.8MB of code. Most of it is game code, rendering, physics, networking, the actual Counter-Strike game. The VAC parts are scattered through the DLL.
The import table tells you a lot about what VAC can and cannot do. Let me show you what I found:
| Module | Count | What VAC Uses It For |
|---|---|---|
| tier0 | 678 | Source2 engine runtime. Functions like Plat_GetRegisteredModules (gets list of loaded DLLs), CRC32_ProcessBuffer (hashing), Plat_GetOSType (detects Windows version) |
| KERNEL32 | 145 | GetCurrentProcessId, GetCurrentThreadId, GetModuleHandleA, GetModuleHandleExA, GetProcAddress, VirtualQuery, GetSystemTimeAsFileTime, IsDebuggerPresent, DecodePointer |
| v8 | 67 | V8 JavaScript engine. This is for game scripting, not VAC |
| steam_api64 | 14 | Steamworks SDK. This is how VAC talks to Steam |
| embree3 | 10 | Intel Embree ray tracing. Game rendering, not VAC |
| ADVAPI32 | 8 | Registry access. RegOpenKeyExA, RegQueryValueExA, event logging |
| WS2_32 | 6 | Winsock. Sending scan results to Valve servers over the network |
| USER32 | 3 | MessageBoxW, GetProcessWindowStation, GetUserObjectInformationW |
| video64 | 2 | Video codecs. Not VAC |
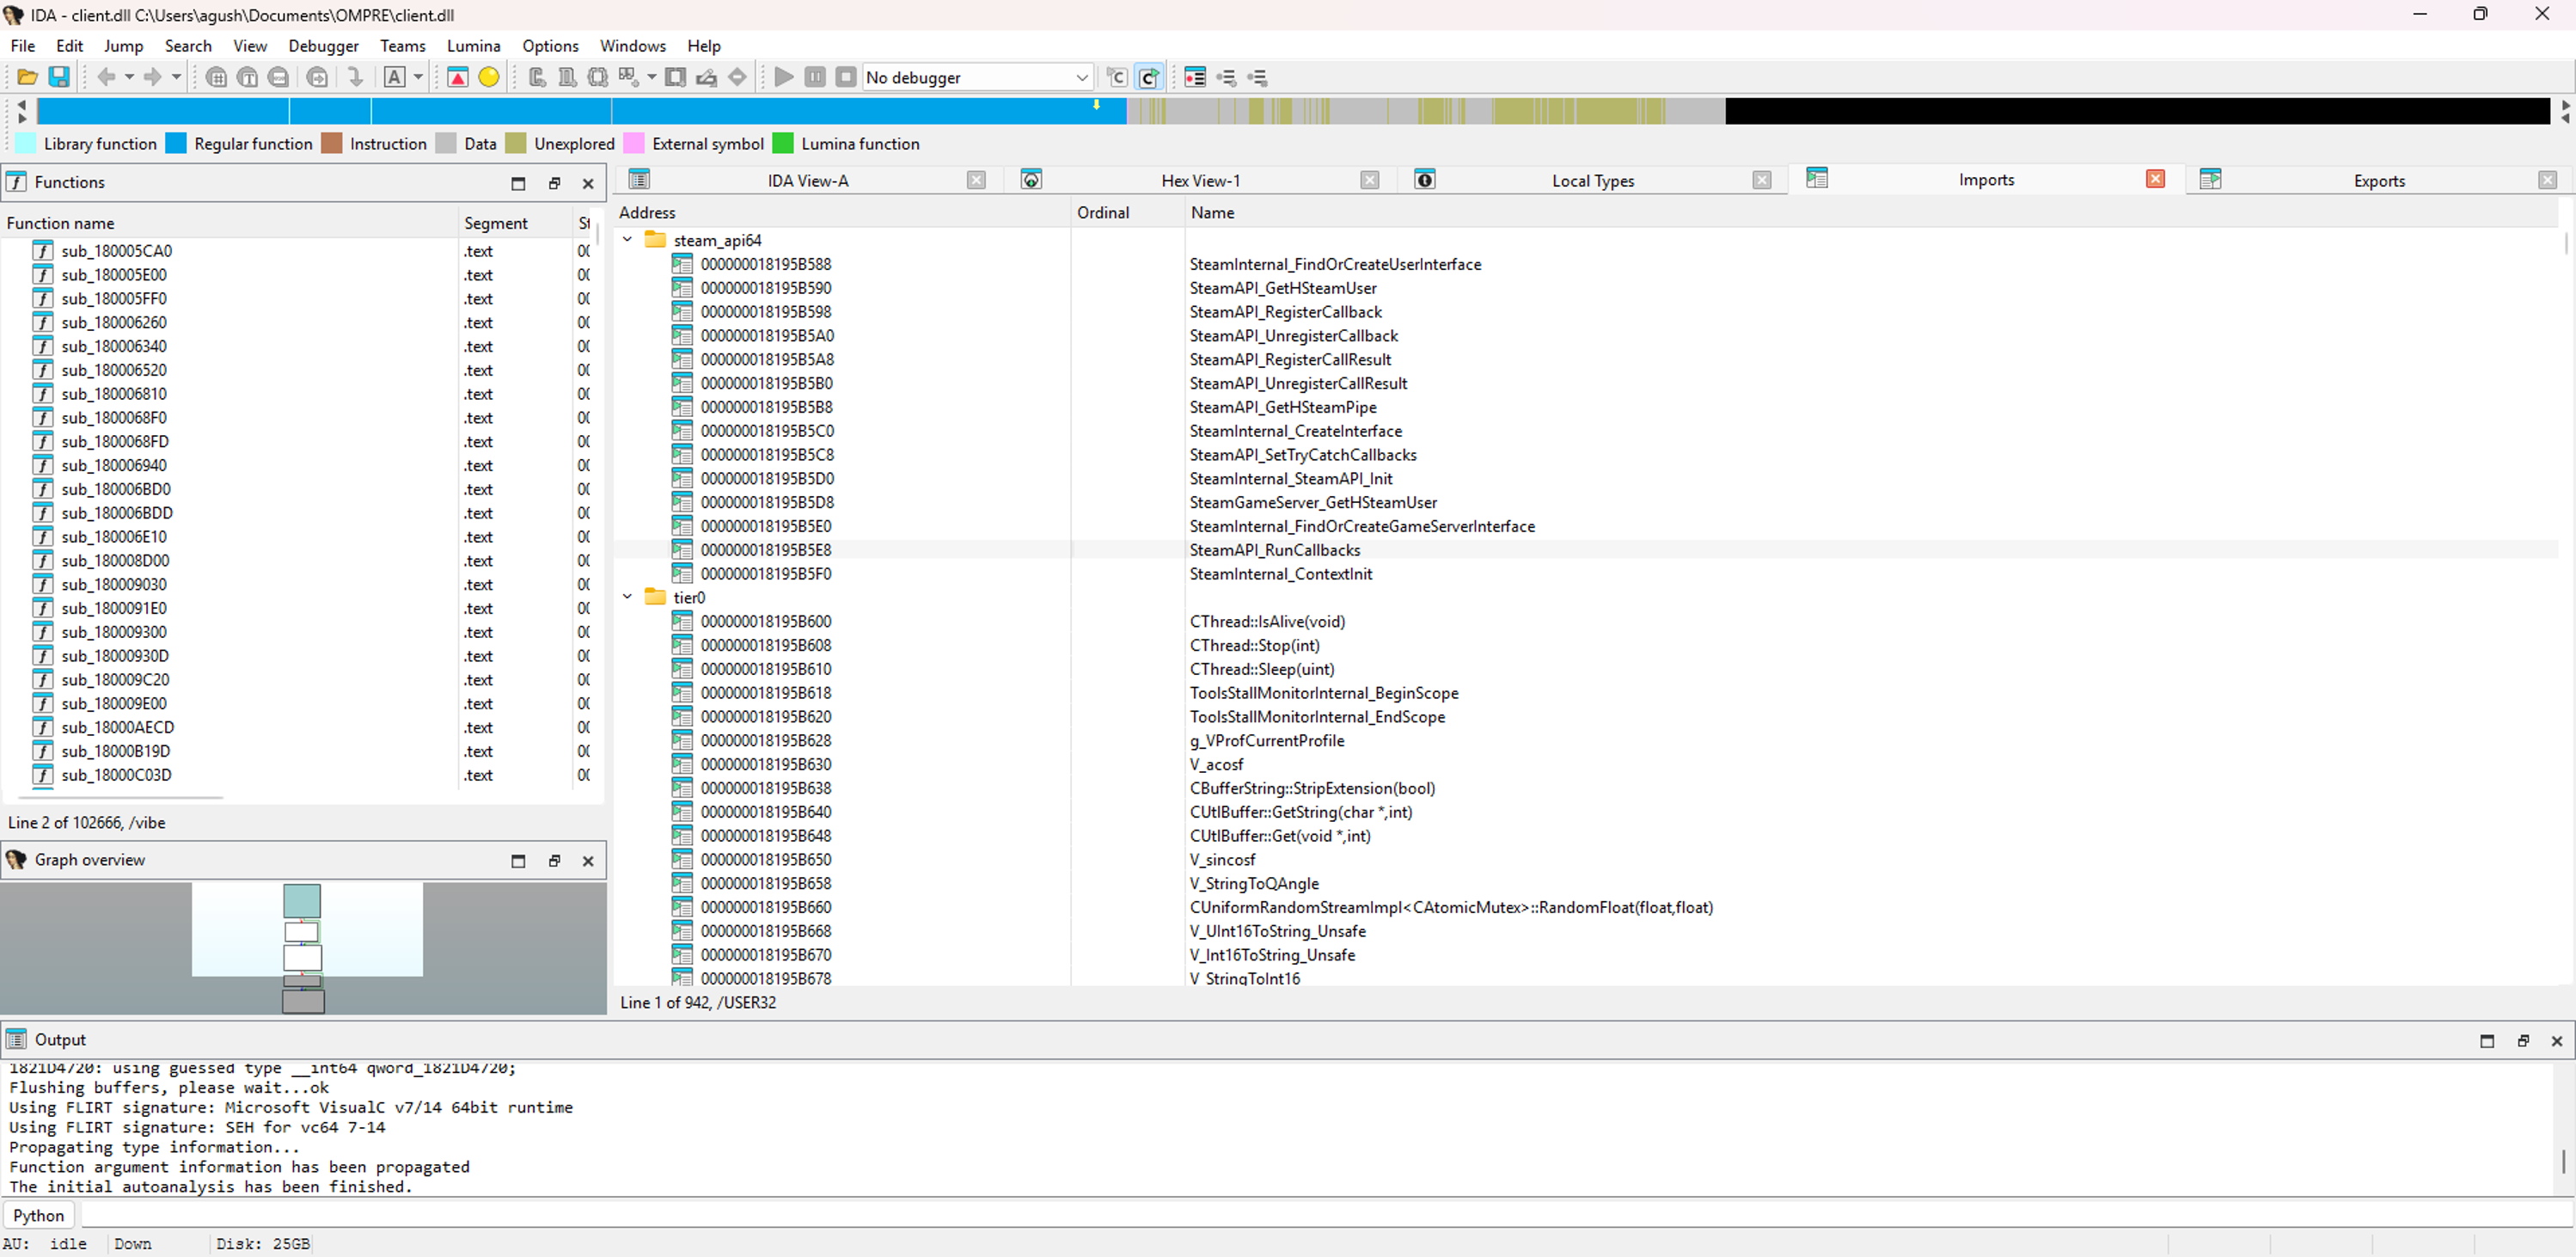
Here is what is missing that you might expect to see:
No ReadProcessMemory. No WriteProcessMemory. No OpenProcess. No CreateRemoteThread. No NtOpenSection. No NtCreateFile.
VAC cannot see outside the game process. It has no cross process visibility. It cannot open handles to other processes. It cannot read or write memory outside cs2.exe. There is no kernel driver. There is no ObRegisterCallbacks (a kernel function that could filter handle creation). VAC only sees what is inside the game process.
This is the single most important thing to understand about VAC. If something lives in a separate process and reads game memory with ReadProcessMemory, VAC inside the game cannot see it. There is no mechanism for that. The external scanner in steam.exe is what watches from outside but that is a separate component and it has its own limitations.
I also searched for strings and found these VAC related ones:
0x18196EC98  "CDllVerificationMonitor"
0x18196ED08  "BSecureAllowed"
0x18196ED40  "NtOpenFile"
0x18196ED80  "LoadLibraryExW"
0x181A37DEC  "UM_RequestDllStatus"
0x181A37E72  "UM_InventoryResponse"
0x181A17634  "NETWORK_DISCONNECT_KICKED_INSECURECLIENT"
0x18200E55C  "IsDebuggerPresent"
0x18200770C  "Plat_GetRegisteredModules"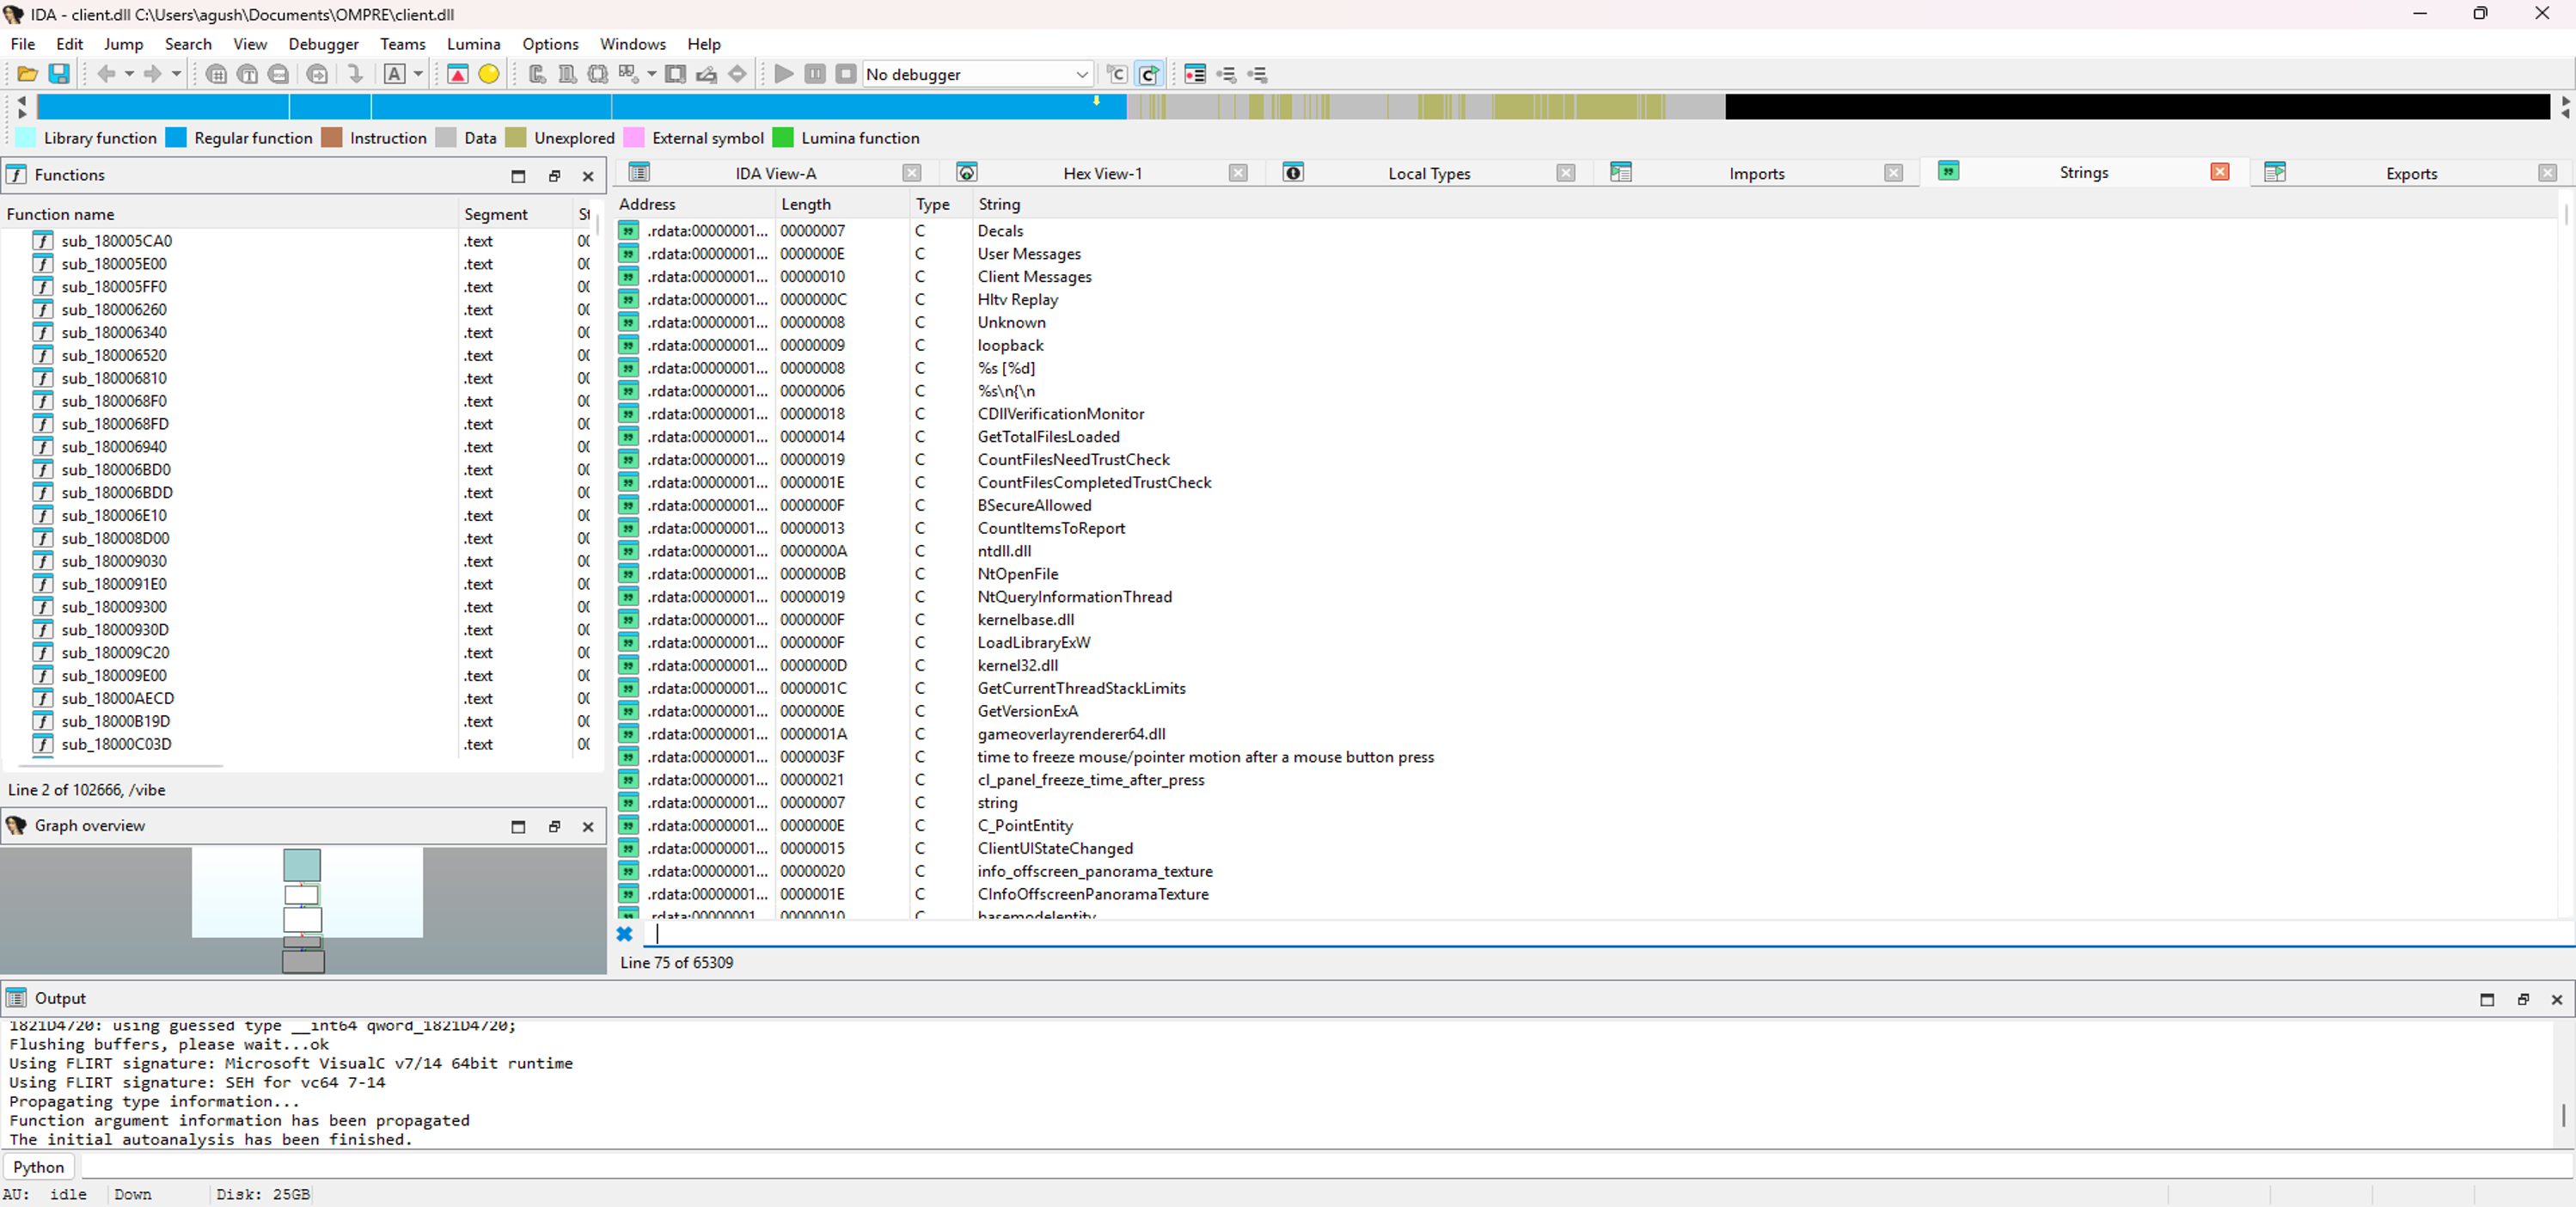
A Note About How I Found Things
Before I show the code I want to explain how I found these functions so you can do it yourself.
IDA gives every function a name like sub_180005450. To find VAC functions I searched for strings. For example I found "CDllVerificationMonitor" at 0x18196EC98. Then I looked at cross references to that string to find what function uses it. That led me to sub_18004D8C0 which turned out to be a constructor for the CDllVerificationMonitor class.
For the server command handler I used the signature from the Aspasia1337 repo. The signature 89 54 24 10 53 56 57 41 54 41 55 41 56 41 57 48 81 EC matched at 0x180003140. That function turned out to be the main server command dispatcher.
For the VEH handler I searched for AddVectoredExceptionHandler since that is a unique API. The cross reference led me to sub_180005920.
After I understood what each function did I renamed them in IDA so the code would be more readable. Here are the ones I renamed:
| Address | New Name | What It Does |
|---|---|---|
0x180005450 | VAC_InventoryResponse_Dispatcher | Main scan pipeline entry. Server says "scan" and this runs all 3 scanners |
0x180003140 | VAC_HandleDiagnosticRequest_Dispatcher | Server command handler. 6 different commands the server can send |
0x180005960 | VAC_VEH_ExceptionHandler | Catches exceptions. Detects hardware breakpoints. 64 entry log with stack dumps |
0x180005920 | VAC_RegisterVEHHandler | Registers the exception handler at highest priority |
0x180152FA0 | VAC_CollectThreadInfo | Checks every new thread for suspicious start addresses |
0x18014E330 | VAC_ScanInterfacePointers_CRC | Scanner 3. Hashes Source2 engine interface vtables |
0x180153390 | VAC_BuildTelemetry_msg159 | Collects 40+ telemetry fields and sends them to server once at connect |
0x1801542A0 | VAC_InitHookTargets | Records addresses of API functions to monitor |
0x18014DBE0 | VAC_PEModuleHash_Scanner1 | Scanner 1. Hashes all loaded DLLs with CRC32 and SHA1 |
| `0x180004A10' | VAC_DumpVEHChain_msg163 | Reads the VEH handler list and reports it to server |
0x1801545B0 | VAC_SendDllStatus_msg158 | Sends module tree CRC as message 158 |
0x1800056F0 | VAC_SendExtraUserData_msg164 | Sends event data about suspicious things found |
0x180004520 | VAC_CollectThreadDiagnostics | Thread diagnostic data collector |
How VAC Starts Up
When client.dll first loads into the game, VAC does a few things to get ready. It registers an exception handler and records the addresses of Windows API functions it wants to watch.
Step 1: Register the Exception Handler
The first thing VAC does is register a Vectored Exception Handler (VEH). Think of this as a emergency callback. When the program crashes or hits a breakpoint, Windows calls all registered VEH handlers in order of priority. VAC registers its handler at the highest priority (1).
Here is the registration function I found at 0x180005920:
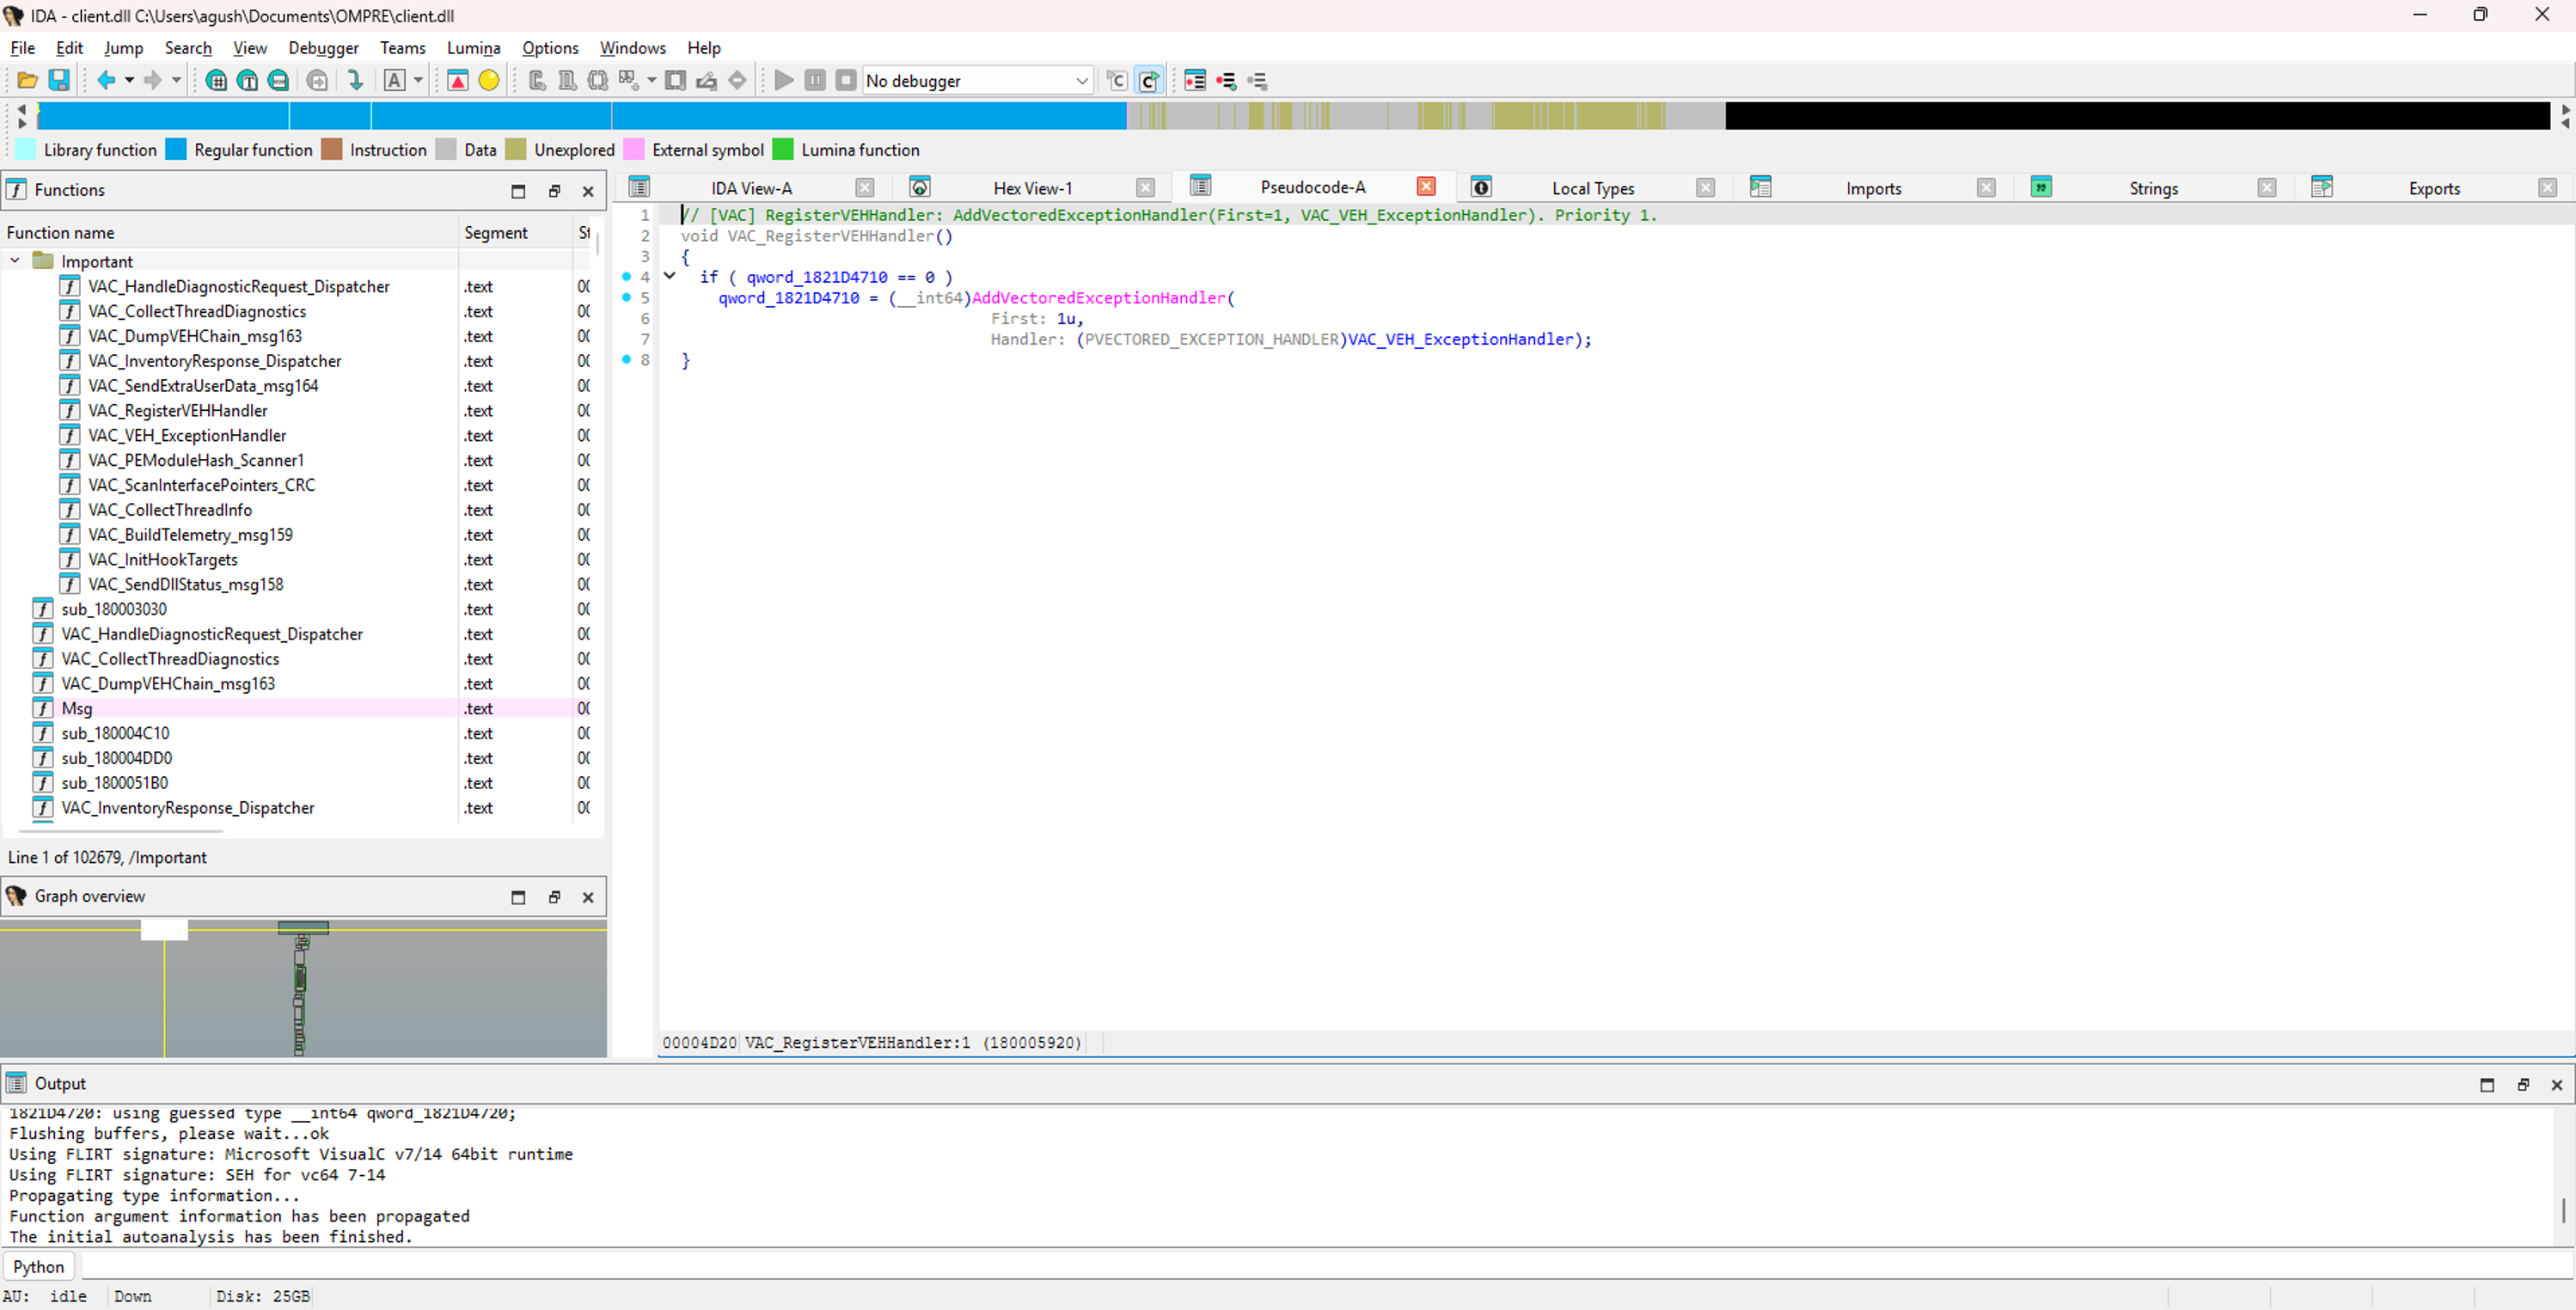
void VAC_RegisterVEHHandler()
{
    if (g_VEHandler == 0)
        g_VEHandler = AddVectoredExceptionHandler(1, VAC_VEH_ExceptionHandler);
}
Why this matters:
The 1 in the first parameter means "First" or highest priority. When an exception happens, Windows calls this handler before any other exception handler in the process. If a cheat registers its own VEH handler with priority 0 (which is the normal priority), VAC handler runs first. This is important for the self-healing trick I will explain later.
The g_VEHandler variable stores the handle returned by AddVectoredExceptionHandler. The check if (g_VEHandler == 0) makes sure it only registers once.
Step 2: Record API Function Addresses
Then VAC resolves the addresses of Windows functions it wants to watch. I found this at 0x1801542A0:
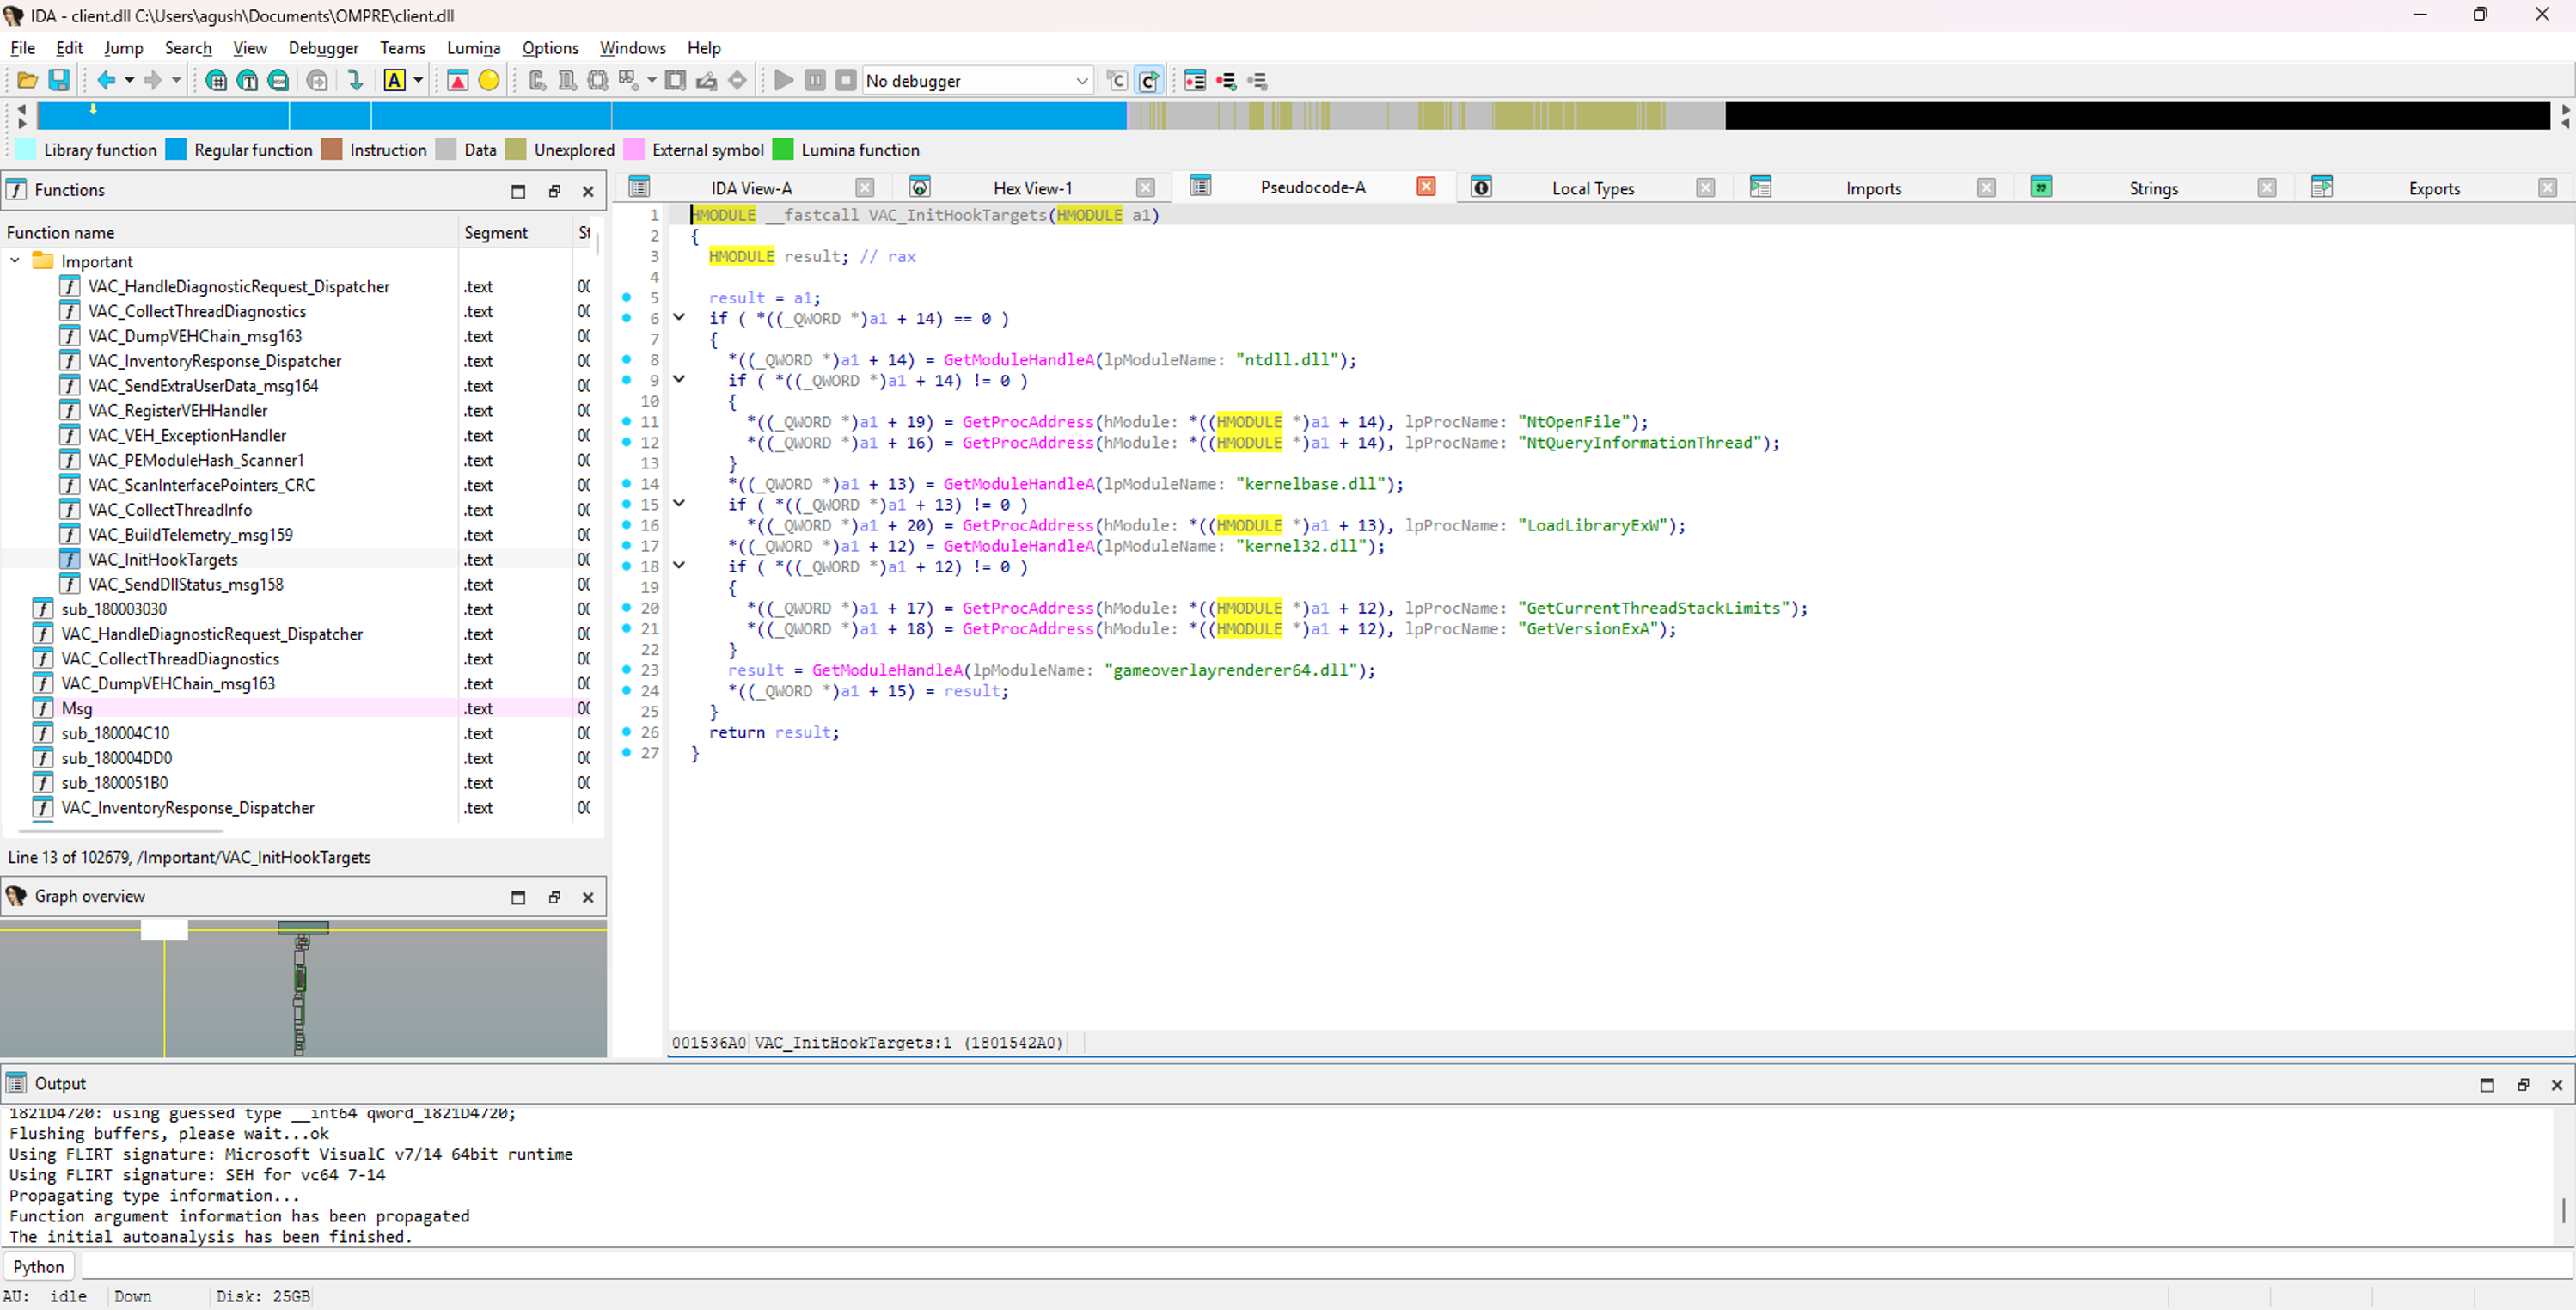
HMODULE VAC_InitHookTargets(Context *ctx)
{
    if (ctx->ntdll != 0)
        return;

    ctx->ntdll = GetModuleHandleA("ntdll.dll");
    if (ctx->ntdll)
    {
        ctx->NtOpenFile = GetProcAddress(ctx->ntdll, "NtOpenFile");
        ctx->NtQueryThread = GetProcAddress(ctx->ntdll, "NtQueryInformationThread");
    }

    ctx->kernelbase = GetModuleHandleA("kernelbase.dll");
    if (ctx->kernelbase)
        ctx->LoadLibraryExW = GetProcAddress(ctx->kernelbase, "LoadLibraryExW");

    ctx->kernel32 = GetModuleHandleA("kernel32.dll");
    if (ctx->kernel32)
    {
        ctx->GetStackLimits = GetProcAddress(ctx->kernel32, "GetCurrentThreadStackLimits");
        ctx->GetVersionEx = GetProcAddress(ctx->kernel32, "GetVersionExA");
    }

    ctx->overlay = GetModuleHandleA("gameoverlayrenderer64.dll");
}
Let me walk through this line by line:
The function takes a Context pointer. This is a structure that VAC uses to store all its data about the game process.
First it checks if (ctx->ntdll != 0). If ntdll is already recorded, it skips everything. This makes sure initialization only happens once.
Then it loads ntdll.dll and gets two function addresses from it:
NtOpenFile- This is the low level function for opening files. VAC wants to know if this function gets hooked (replaced with cheat code).NtQueryInformationThread- This is used to get information about threads. VAC uses it to find where threads started.
Then it loads kernelbase.dll and gets LoadLibraryExW. This is the function used to load DLLs. If a cheat injects a DLL using LoadLibrary, the hook on this function would catch it.
Then it loads kernel32.dll and gets two functions:
GetCurrentThreadStackLimits- Gets the stack boundaries for the current thread. Used to detect stack manipulation.GetVersionExA- Gets the Windows version. Used to detect OS spoofing.
Finally it records the base address of gameoverlayrenderer64.dll. This is the Steam overlay. VAC checks that the overlay is present as a trust signal.
Key insight: VAC records 6 function addresses but later only checks 2 of them for hooks (NtOpenFile and LoadLibraryExW). And each check is only the first 8 bytes. More on this when we get to the thread checker.
How VAC Checks If You Are Secure
There is a class called CDllVerificationMonitor. I found its string at 0x18196EC98. This class has a method that acts as a trust gate. When the server sends a request, this method checks if the game is running in insecure mode.
bool CDllVerificationMonitor_Init(Context *ctx)
{
    if (!ctx->pfnGetTotal || !ctx->pfnNeedCheck || !ctx->pfnCompleted
     || !ctx->pfnBSecureAllowed || !ctx->pfnCountItems)
        return false;

    ctx->nCountCurrent = ctx->pfnCountItems();

    if (!ctx->bInsecureFlag)
    {
        ctx->bInsecureFlag = (ctx->pfnBSecureAllowed(0, 0, 0) == 0);
        if (ctx->bInsecureFlag)
        {
            g_VAC_InsecureFlag = 1;
            g_pVAC_NotifyInterface->vtable[1472](g_pVAC_NotifyInterface);
        }
    }

    return ctx->nCountCurrent != ctx->nCountPrevious;
}
What this does:
It checks if 5 function pointers are valid. These are callbacks provided by the engine. If any are NULL something is wrong and it returns false.
It calls pfnCountItems() to get the current count of something (probably modules or loaded items).
It checks bInsecureFlag. If not set yet, it calls BSecureAllowed(0, 0, 0).
BSecureAllowed is the trust check. It returns 0 if the process is insecure (unsigned modules loaded, etc). If insecure, VAC sets the insecure flag to 1 and calls a notify interface at vtable offset 1472 to tell the server.
The function returns whether the count changed since last check. If a new module was loaded, it returns true and triggers a scan.
The Scan Pipeline
When the server asks VAC to run a scan, it sends a message called UM_RequestDllStatus. I found this string at 0x181A37DEC. This triggers the main scan pipeline at 0x180005450.
Here is the flow from the decompilation:
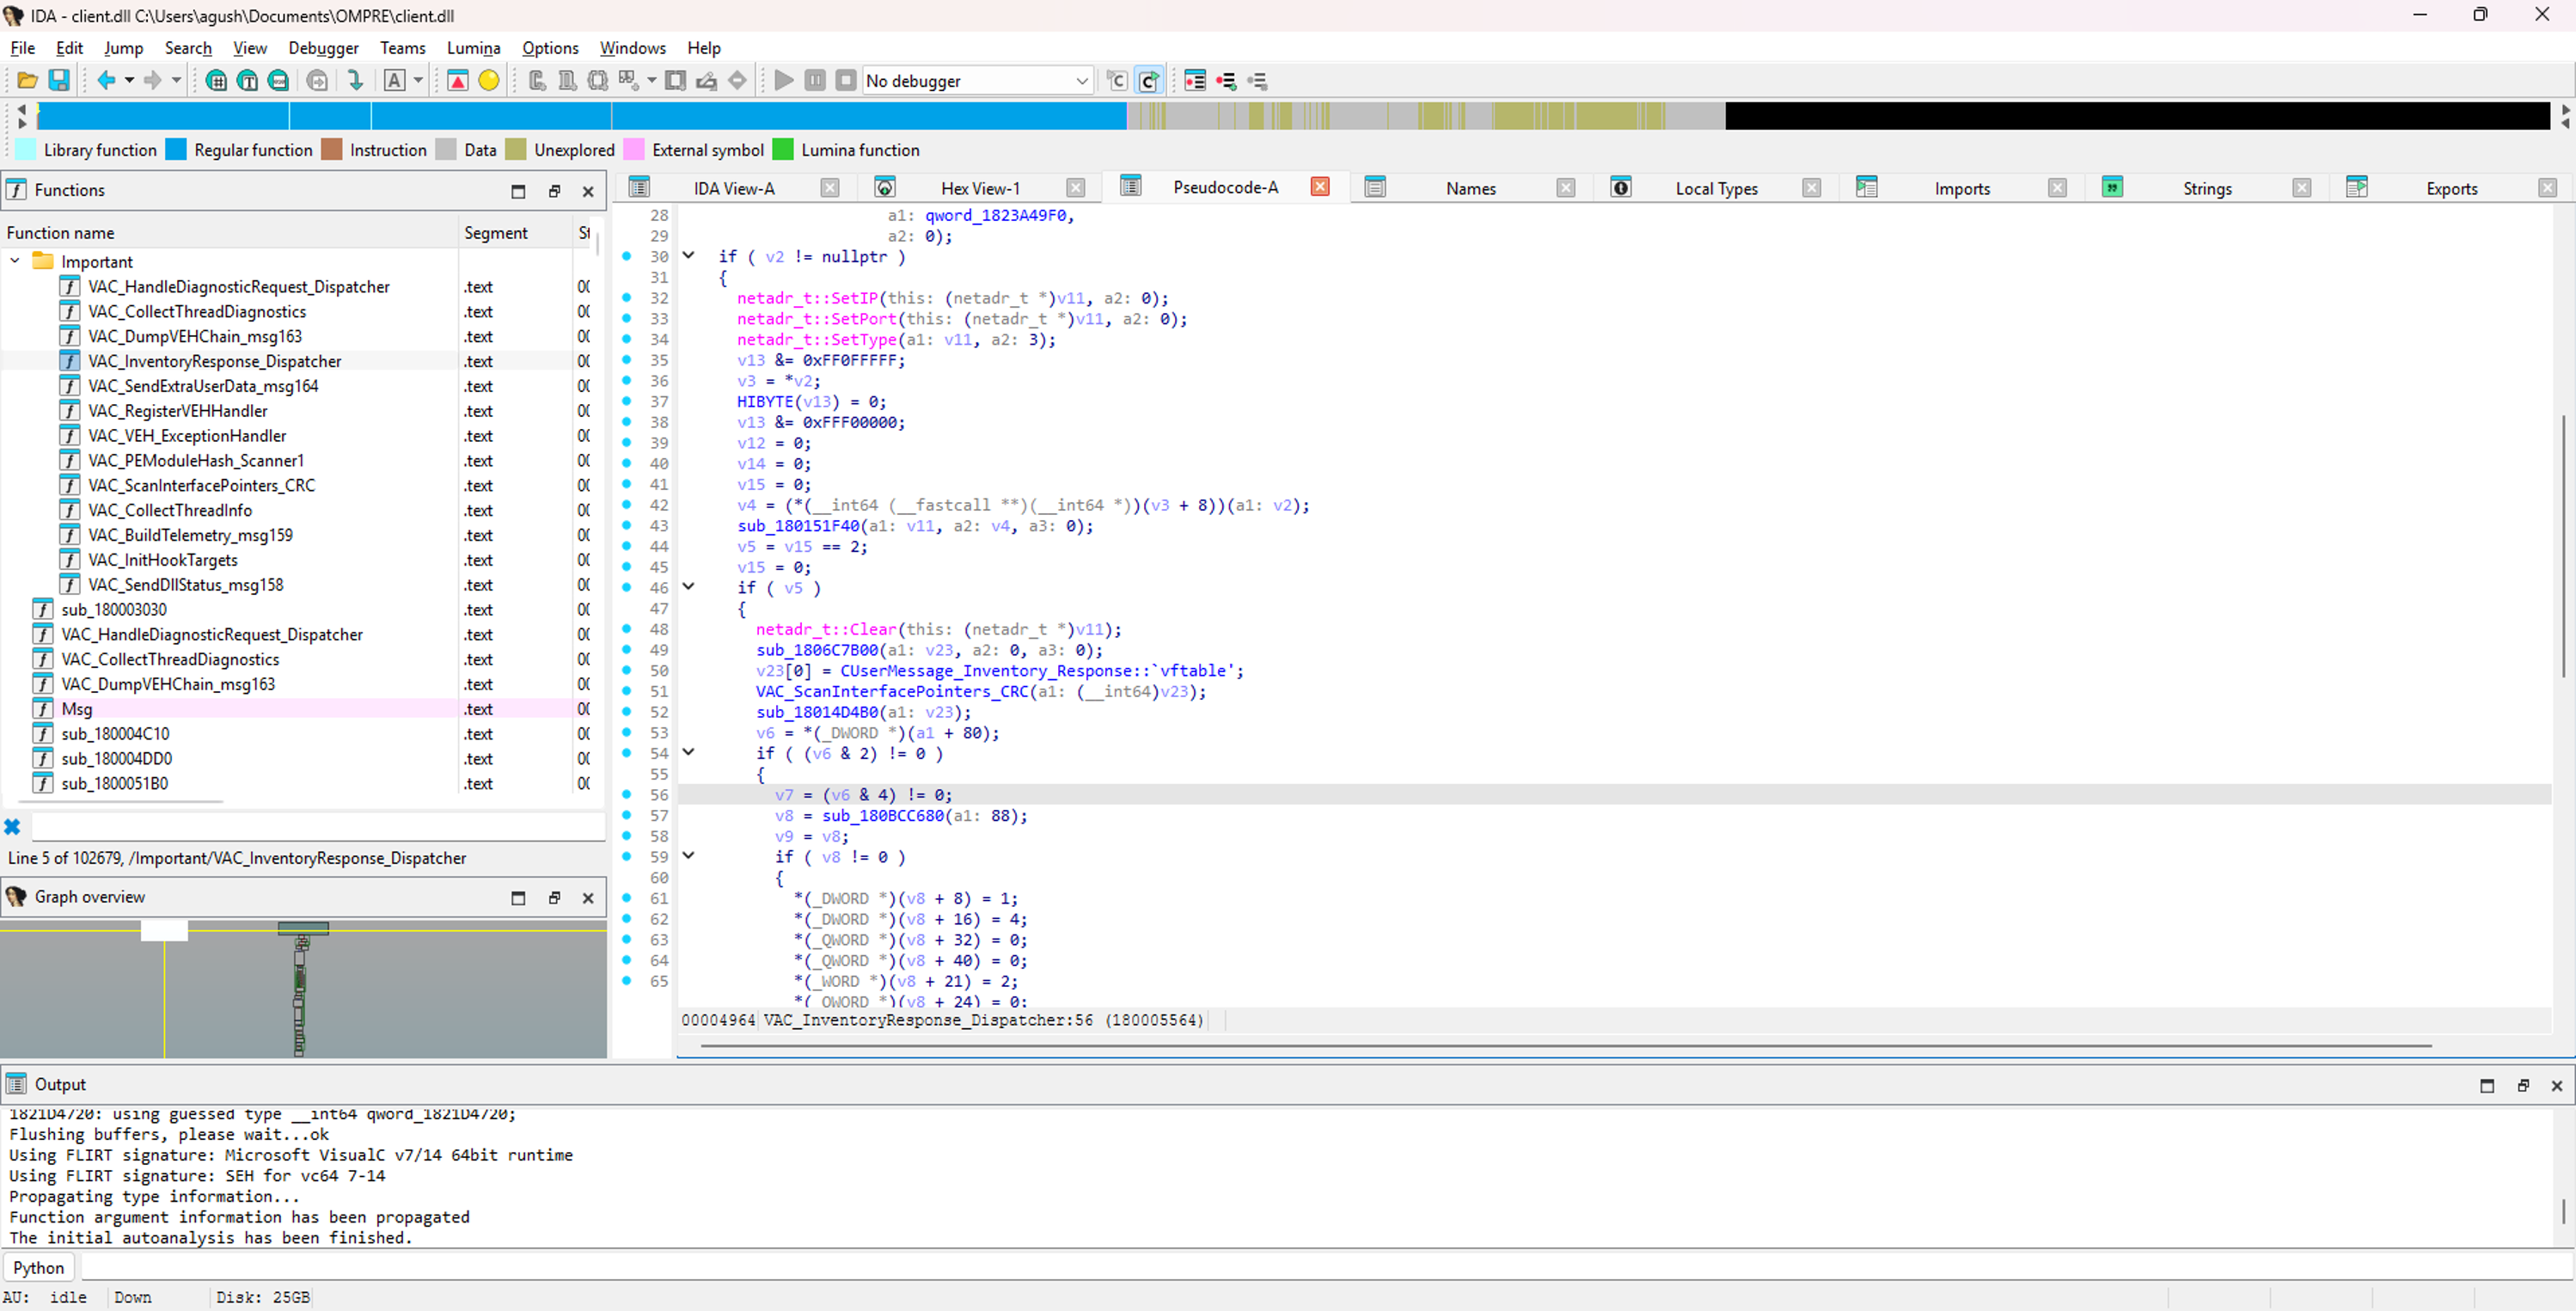
void VAC_InventoryResponse_Dispatcher(void *a1)
{
    channel = networkChannel->GetInterface(0);
    if (!channel) return;

    net_addr.SetIP(0);
    net_addr.SetType(3);

    state = channel->QueryState();
    if (state == STATE_CONNECTED)
    {
        VAC_ScanInterfacePointers_CRC(scanCtx);
        sub_18014D4B0(scanCtx);

        if (*(int*)(a1 + 0x50) & 2)
        {
            job = AllocJob(sizeof(Job));
            job->type = 1;
            job->priority = 4;
            job->threadPool = g_pThreadPool;
            g_pThreadPool->SubmitJob(job);
            job->Execute();
        }

        sub_180B065F0(msg, 161, scanCtx);
        channel->Send(msg);
    }
}
Walking through this function:
- It gets the network channel. This is how VAC talks to the game server. If there is no channel it returns and does nothing.
- It sets up a network address with type NA_IP (type 3). This is used for sending the response.
- It queries the connection state. If the game is not connected to a server (state != 2), it skips everything.
- If connected, it runs Scanner 3 (Interface CRC) at 0x18014E330. This hashes the game engine interface vtables.
- It runs what I believe is Scanner 2 (Engine VMT frequency map) at 0x18014D4B0. I did not dig deep into this one.
- It checks a flag at
a1 + 0x50. If bit 1 is set (value 2), it queues Scanner 1 as a thread pool job. Scanner 1 is the PE Module Hash that hashes all DLLs. It runs asynchronously because it is expensive.
- It sends everything as message 161 through the network channel.
Three scanners run as a batch:
| Scanner | Address | What It Does |
|---|---|---|
| Scanner 3 | 0x18014E330 | Interface CRC. Hashes 112 Source2 engine interface vtables |
| Scanner 2 | 0x18014D4B0 | Engine VMT frequency map. I did not dig into this one |
| Scanner 1 | 0x18014DBE0 | PE Module Hash. CRC32 + SHA1 of all loaded DLLs |
Scanner 3: The Interface CRC Check
This scanner at 0x18014E330 checks the game engine vtables. A vtable is a table of function pointers that C++ uses for virtual functions. If a cheat wants to intercept a game function like Present (DirectX drawing), it can replace an entry in the vtable to point to its own function instead.
VAC wants to detect that. Here is how.
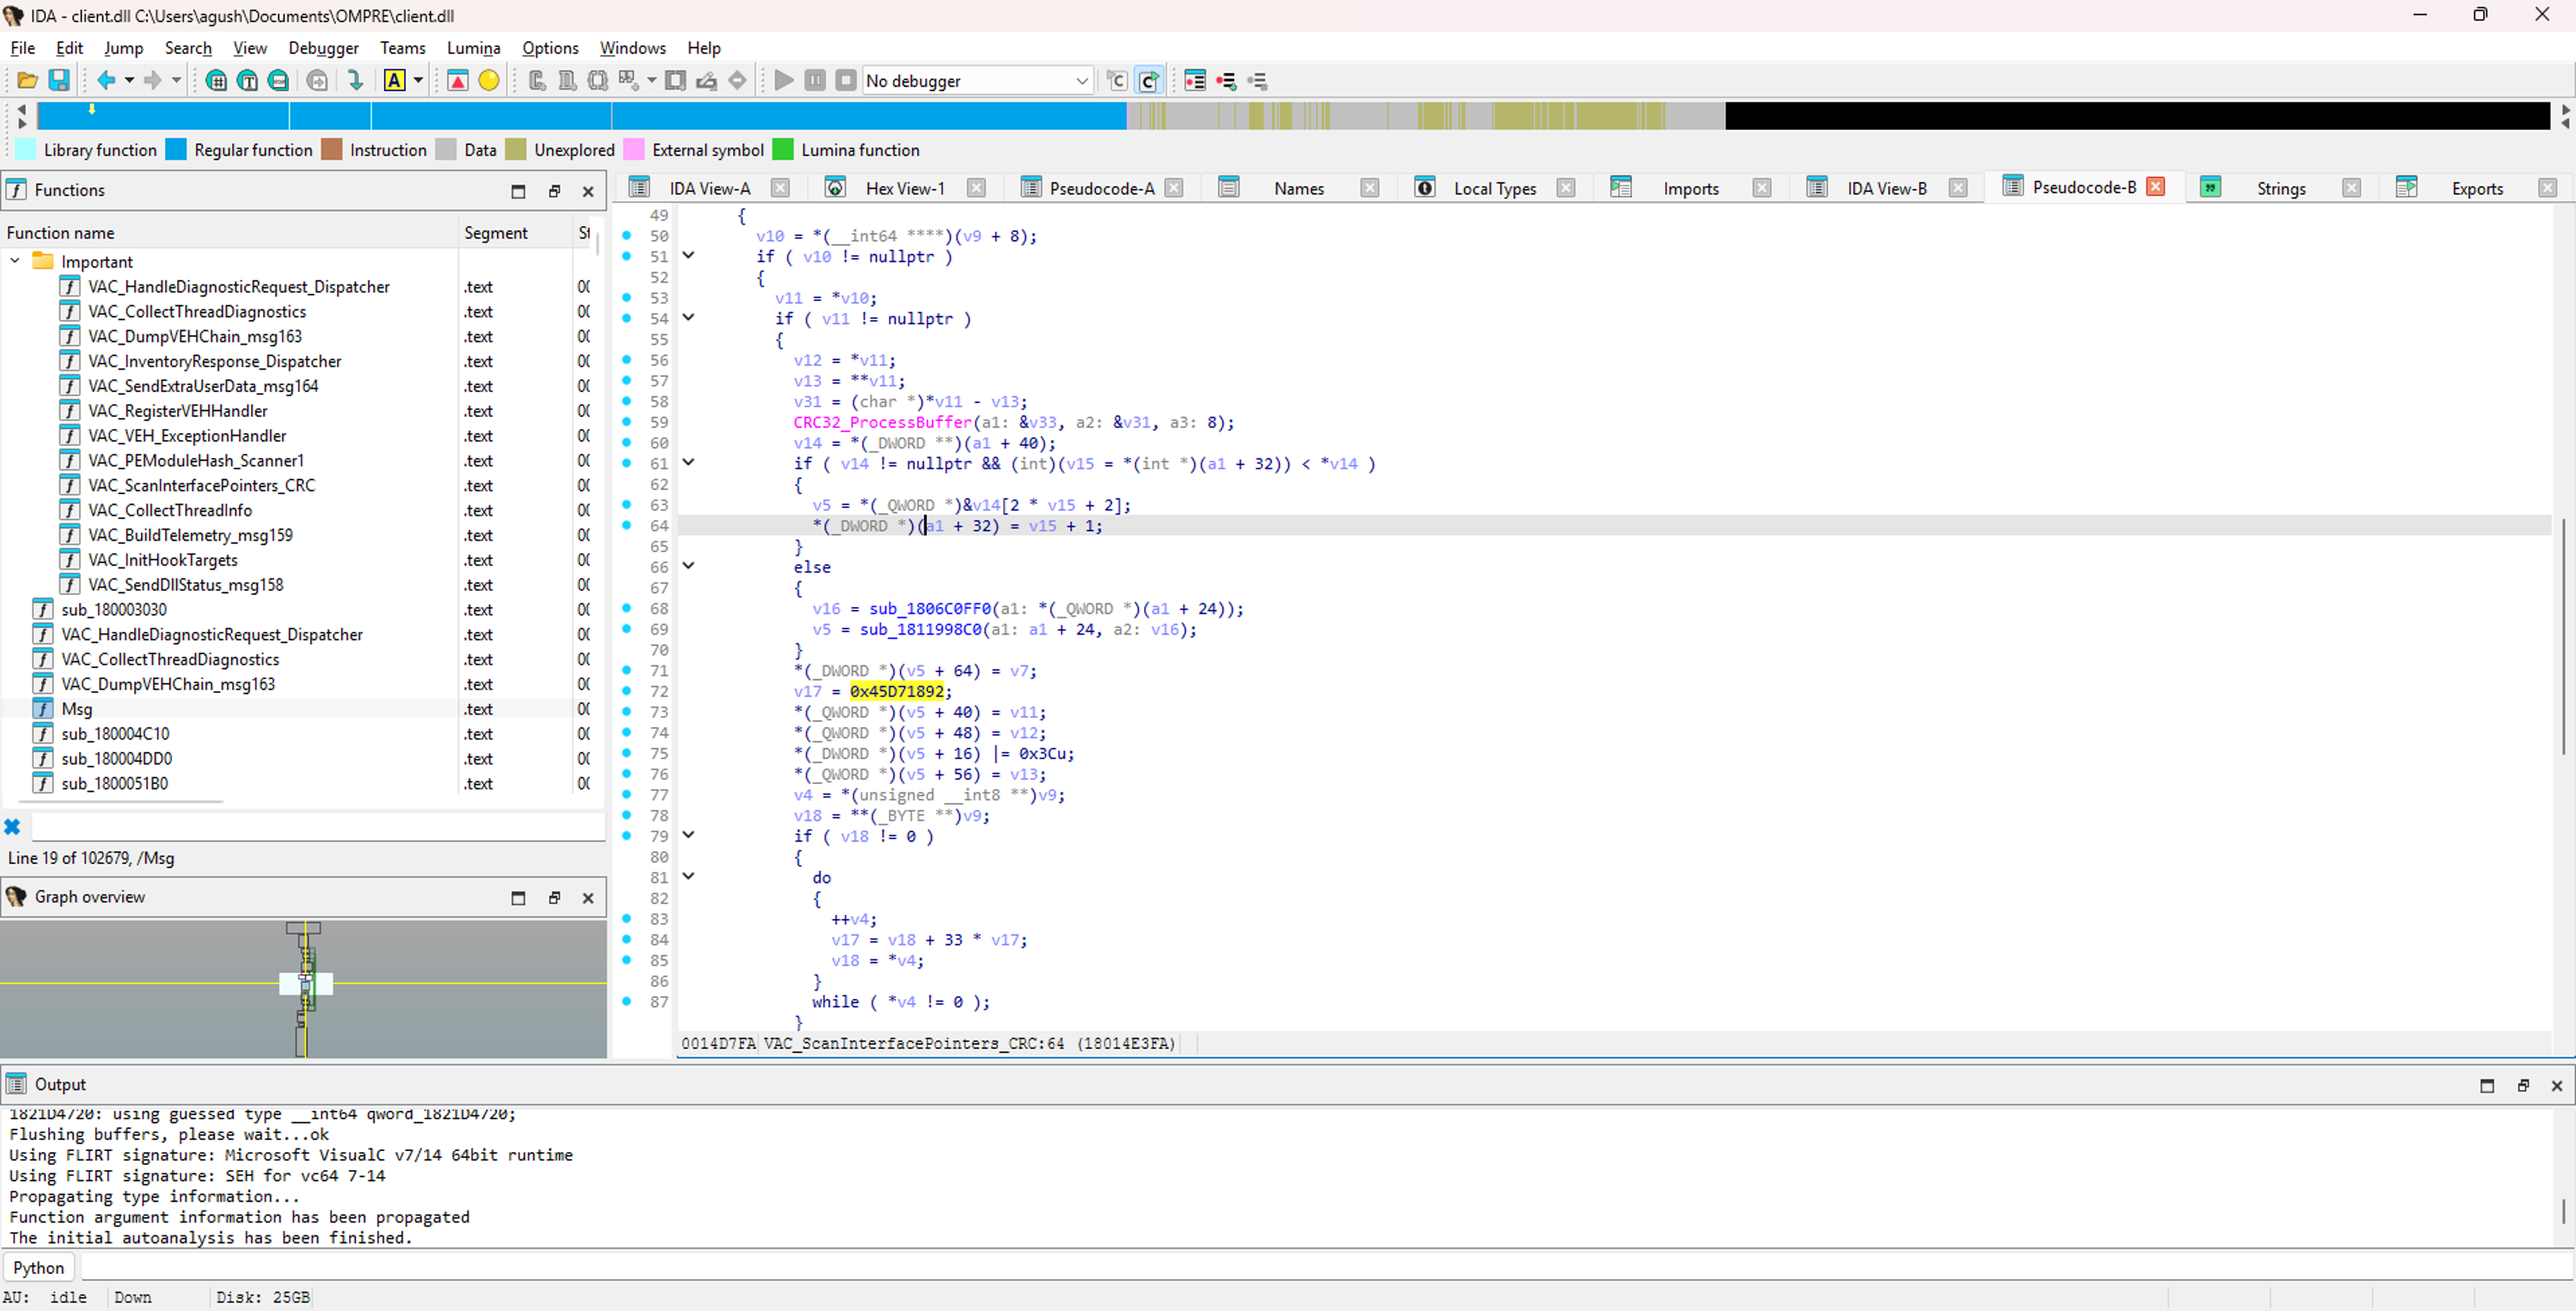
void VAC_ScanInterfacePointers_CRC(ScanContext *ctx)
{
    uint64_t startTime = __rdtsc();
    int32_t crc = 0xFFFFFFFF;
    int count = 0;

    list = GetInterfaceList(&count);
    ctx->interfaceCount = count;

    for (int i = 0; i < count; i++)
    {
        vtable = *(void***)list[i].instance;
        if (!vtable) continue;

        vfunc0 = vtable[0];
        if (!vfunc0) continue;

        offset = (uintptr_t)vtable - (uintptr_t)vfunc0;
        CRC32_ProcessBuffer(&crc, &offset, 8);

        entry = ctx->AllocateEntry();
        entry->index = i;
        entry->vtable_ptr = vtable;
        entry->vtable_0 = vfunc0;
        entry->first_instr = *(uintptr_t*)vfunc0;

        uint32_t nameHash = 1171724434;
        for (const char *p = list[i].name; *p; p++)
            nameHash = *p + 33 * nameHash;
        entry->nameHash = nameHash;
    }

    ctx->crcResult = ~crc;

    ctx->flags |= 0x10;
    ctx->field_112 = dword_1821D4748;
    ctx->flags |= 0x80;
    ctx->field_124 = call_engine_function();
    ctx->flags |= 0x200;
    ctx->osType2 = dword_1821D474C;
    ctx->flags |= 0x100;
    ctx->cachedField = qword_1821D4750;
    ctx->osType = Plat_GetOSType();
    ctx->flags |= 0x20;
    ctx->osType2again = Plat_GetOSType();
    ctx->flags |= 4;

    uint64_t endTime = __rdtsc();
    ctx->scanDuration = 1000000 * (endTime - startTime) / Plat_CPUTickFrequency();
    ctx->flags |= 0x48;
    ctx->field_120 = 0;
}
Let me explain this code carefully.
First it gets the current CPU timestamp using __rdtsc(). This is a CPU instruction that reads the timestamp counter. It uses this to measure how long the scan takes. It stores the result in scanDuration at the end.
It initializes a CRC32 accumulator to 0xFFFFFFFF. CRC32 is a hash algorithm that produces a 32 bit checksum. VAC uses it to check if anything changed.
It gets a list of all registered Source2 engine interfaces. Source2 is the game engine that CS2 runs on. Each interface is a C++ class with a vtable.
The loop does three things for each interface:
Step 1: It gets the vtable pointer. The vtable is a pointer to an array of function pointers. *(void***)instance reads the vtable pointer from the object instance.
Step 2: It gets vfunc0. This is vtable[0] which is the first virtual function in the interface. Every C++ object with virtual functions has at least vtable[0] which usually points to a destructor or the first declared virtual method.
Step 3: It computes the CRC input as (uintptr_t)vtable - (uintptr_t)vfunc0. This is the offset between the vtable pointer and the first function pointer. This is stable across ASLR because both values shift by the same amount when the DLL is relocated.
Then it calls CRC32_ProcessBuffer with this 8 byte offset. This updates the CRC accumulator.
I confirmed there is only ONE CRC32_ProcessBuffer call in this entire function. Only vtable[0] is hashed.
After the CRC, it fills in an entry structure with:
vtable_ptrat offset +40: the address of the vtablevtable_0at offset +48: the address of the first functionfirst_instrat offset +56: the first 8 bytes of the function that vtable[0] points to
This last field is important. It reads the actual machine code bytes at the start of vtable[0]. If someone replaced vtable[0] with a pointer to cheat code, those bytes would be different.
Then it computes a hash of the interface name using a custom DJB2 algorithm:
uint32_t nameHash = 1171724434;
for (const char *p = name; *p; p++)
    nameHash = *p + 33 * nameHash;
This is a VAC fingerprint. The standard DJB2 hash uses seed 5381. VAC uses seed 1171724434 (0x45C26B12). I found this constant at address 0x18014E41C in the decompilation:
v17 = 1171724434; /*0x18014e41c*/If you see this constant in any binary, that is VAC code. It is unique to Valve.
After the loop VAC appends metadata to the scan context:
- OS type from
Plat_GetOSType()(called twice for some reason) - A cached OS type value from a global variable at
0x1821D4748 - Another cached value from
0x1821D474C - A pointer value from
0x1821D4750 - The scan duration in microseconds calculated as
1000000 * (end - start) / CPU frequency
What does this tell the server?
The server receives:
- A CRC32 hash that represents the layout of all interface vtables
- The actual address of each vtable and its first function
- The first 8 bytes of machine code at vtable[0]
- A hash of each interface name
- OS type and timing metadata
If vtable[0] was replaced, the CRC would change (because the offset vtable_ptr - vfunc0 would be different). If vtable[0] target function was hooked with an inline JMP, the first_instr bytes would be different.
But only vtable[0] is checked. If someone replaces vtable[1] through vtable[N], the CRC does not change because the CRC only uses the offset between vtable and vtable[0], not the individual entries. The verbatim vtable values are sent to the server but they are not part of the CRC. Whether the server compares them against expected values I do not know.
Scanner 1: The PE Module Hash
This is the biggest scanner at 0x18014DBE0 with about 0x74B bytes of decompiled code. It hashes every loaded DLL in the game process.
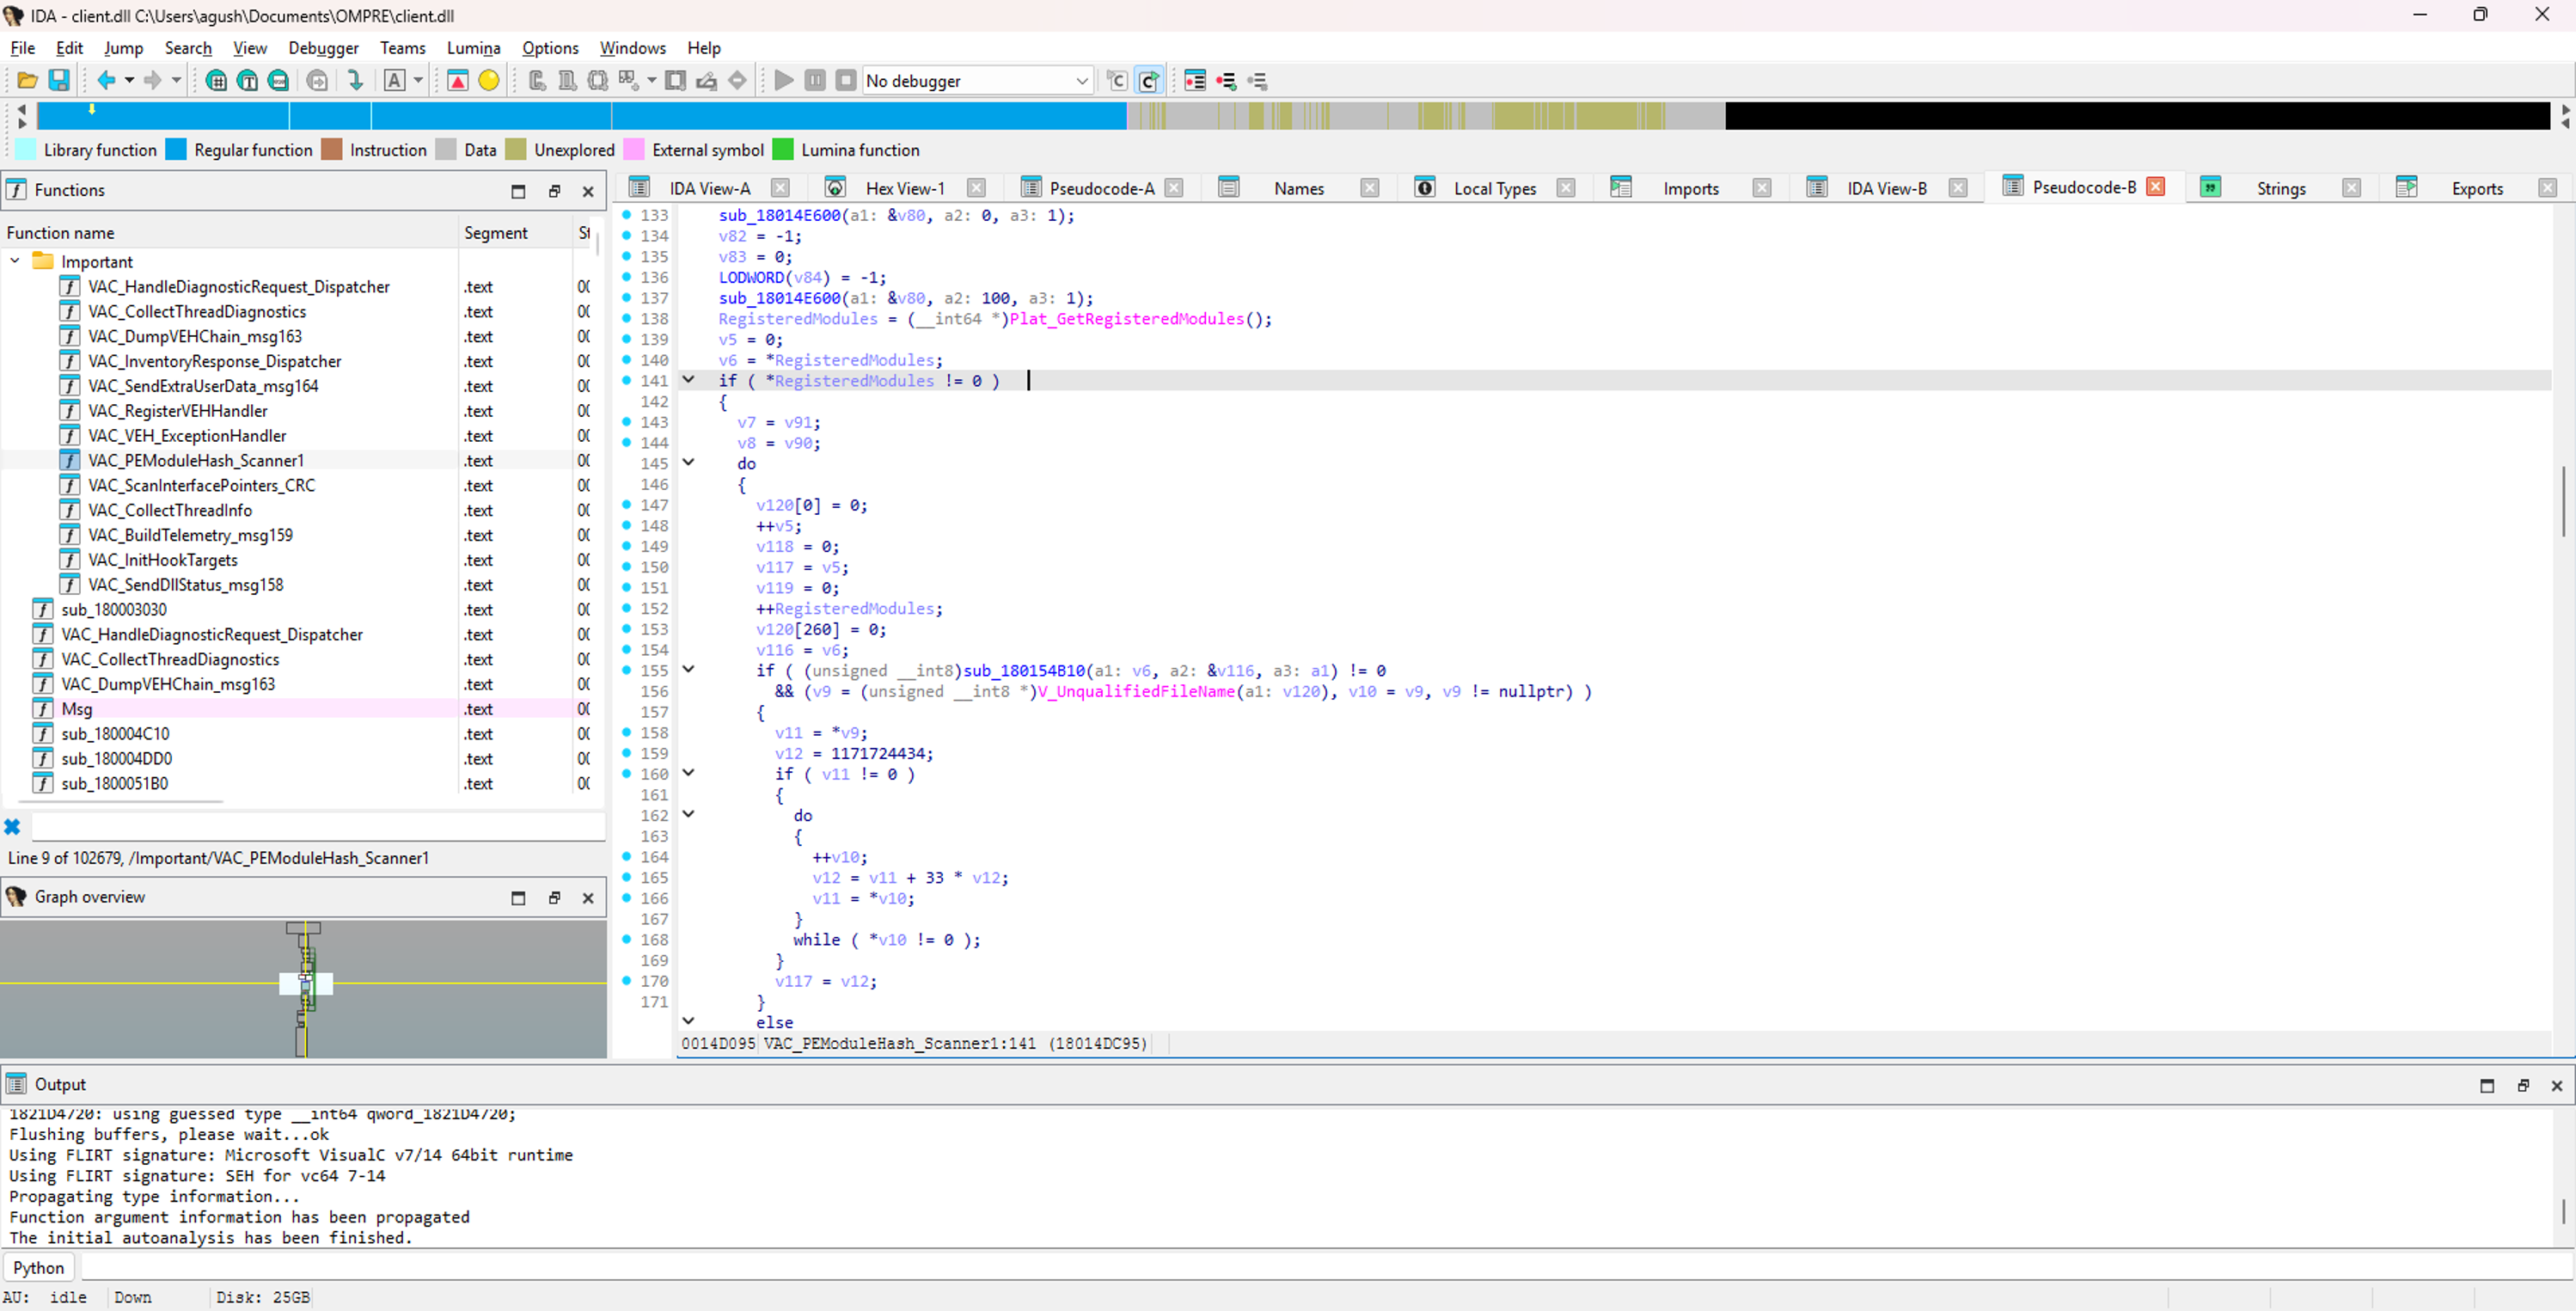
void VAC_PEModuleHash_Scanner1(unsigned char flag)
{
    uint64_t startTime = __rdtsc();

    CRC32_Init(&crc1, 0);
    CRC32_Init(&crc2, 100);

    RegisteredModules = Plat_GetRegisteredModules();

    while (*RegisteredModules != 0)
    {
        modulePath = *RegisteredModules;

        if (sub_180154B10(modulePath, &moduleInfo, flag))
        {
            fileName = V_UnqualifiedFileName(modulePath);
            if (fileName)
            {
                uint32_t nameHash = 1171724434;
                for (const char *p = fileName; *p; p++)
                    nameHash = *p + 33 * nameHash;
                moduleNameHash = nameHash;
            }

            CRC32_ProcessBuffer(&globalCRC, &moduleSectionData, 4);
        }

        RegisteredModules++;
    }

    cachedCRC = ~globalCRC;

    ctx->field_100 = cachedCRC;
    ctx->flags |= 3;
    ctx->osType1 = dword_1821D4748;
    ctx->timestamp = call_engine_function();
    ctx->flags |= 0x380;
    ctx->osType2 = dword_1821D474C;
    ctx->cachedValue = qword_1821D4750;
    ctx->osType3 = Plat_GetOSType();
    ctx->osType4 = Plat_GetOSType();
    ctx->scanDuration = 1000000 * (endTime - startTime) / Plat_CPUTickFrequency();

    SendMessage(161, ctx);
}
Walking through this:
It initializes two CRC32 accumulators with seeds 0 and 100. Two separate hashes for extra reliability.
It calls Plat_GetRegisteredModules(). This gets a list of all modules (DLLs) that are officially loaded in the process. It comes from the Source2 engine, not from Windows PEB.
For each module it:
- Calls
sub_180154B10which I think checks if the module needs to be rehashed (maybe it was already hashed before)
- Extracts the filename from the full path using
V_UnqualifiedFileName
- Hashes the filename with the same DJB2 variant (seed 1171724434)
- Computes CRC32 over a section of the module data
- Moves to the next module
At the end it inverts the CRC (cachedCRC = ~globalCRC) which is how CRC32 finalization works, then appends all the metadata (OS type, timestamp, timing) and sends as message 161.
But here is the important part. Before hashing, VAC normalizes the PE image.
I found these steps from tracing the code:
- VirtualAlloc a private copy of the module
- Apply only DIR64 relocations (type 0xA000). Other relocation types are ignored
- Zero the Export Directory (
DataDirectory[0]) - Zero the Import Directory (
DataDirectory[12]) - Skip sections where
Characteristics & 0x80000000
The last point means sections with the MEM_WRITE flag are excluded from hashing.
Why does VAC normalize before hashing?
Without normalization, the hash would change every time Windows loads the DLL at a different base address (ASLR). The relocation fixups would cause different bytes in the image copy. By only applying DIR64 relocations and zeroing the IAT/EAT, VAC gets a consistent hash regardless of where the DLL is loaded.
Why skip MEM_WRITE sections?
Sections like .data and .bss contain writable data. Global variables, function pointers stored in memory, caches. These change constantly during normal game operation. If VAC hashed them, the hash would be different every scan even with no cheating. So VAC skips them.
Here is what gets hashed and what does not for client.dll itself:
| Section | Characteristics | Hashed? | Why |
|---|---|---|---|
| .text | 0x60000020 (CODE+EXEC+READ) | Yes | Core code. Changes here mean tampering |
| .rdata | 0x40000040 (INITIALIZED+READ) | Yes | Read only data, IAT is zeroed first |
| .data | 0xC0000040 (INITIALIZED+READ+WRITE) | No | MEM_WRITE flag set, excluded |
| .bss | UNINITIALIZED+READ+WRITE | No | MEM_WRITE flag set, excluded |
| .pdata | 0x40000040 (INITIALIZED+READ) | Yes | Exception handling data |
| .reloc | 0x42000040 (DISCARDABLE+INITIALIZED+READ) | Yes | DISCARDABLE alone does not exclude |
This means if something modifies a global variable in .data, the hash does not change. VAC cannot detect that type of modification through PE hashing.
The VEH Exception Handler
This is the most interesting part of VAC in my opinion. The handler at 0x180005960 catches exceptions and records them for the server to analyze.
Before I explain the code, let me explain what VEH is for beginners.
What is a Vectored Exception Handler?
When a Windows program crashes or hits a breakpoint, the operating system needs to decide what to do. Normally it would crash the program. But you can register a VEH to intercept these events first. The VEH gets called with information about what happened. It can inspect the crash, log it, fix it, or let it continue.
Cheats sometimes use VEH for "page guard hooks". They mark a function page as "no access". When the game calls that function, the CPU triggers an access violation. The cheat VEH catches it, runs some code, then lets the function execute. This is useful because the function bytes are never modified.
VAC registers its own VEH to detect cheats doing this.
The Handler Code
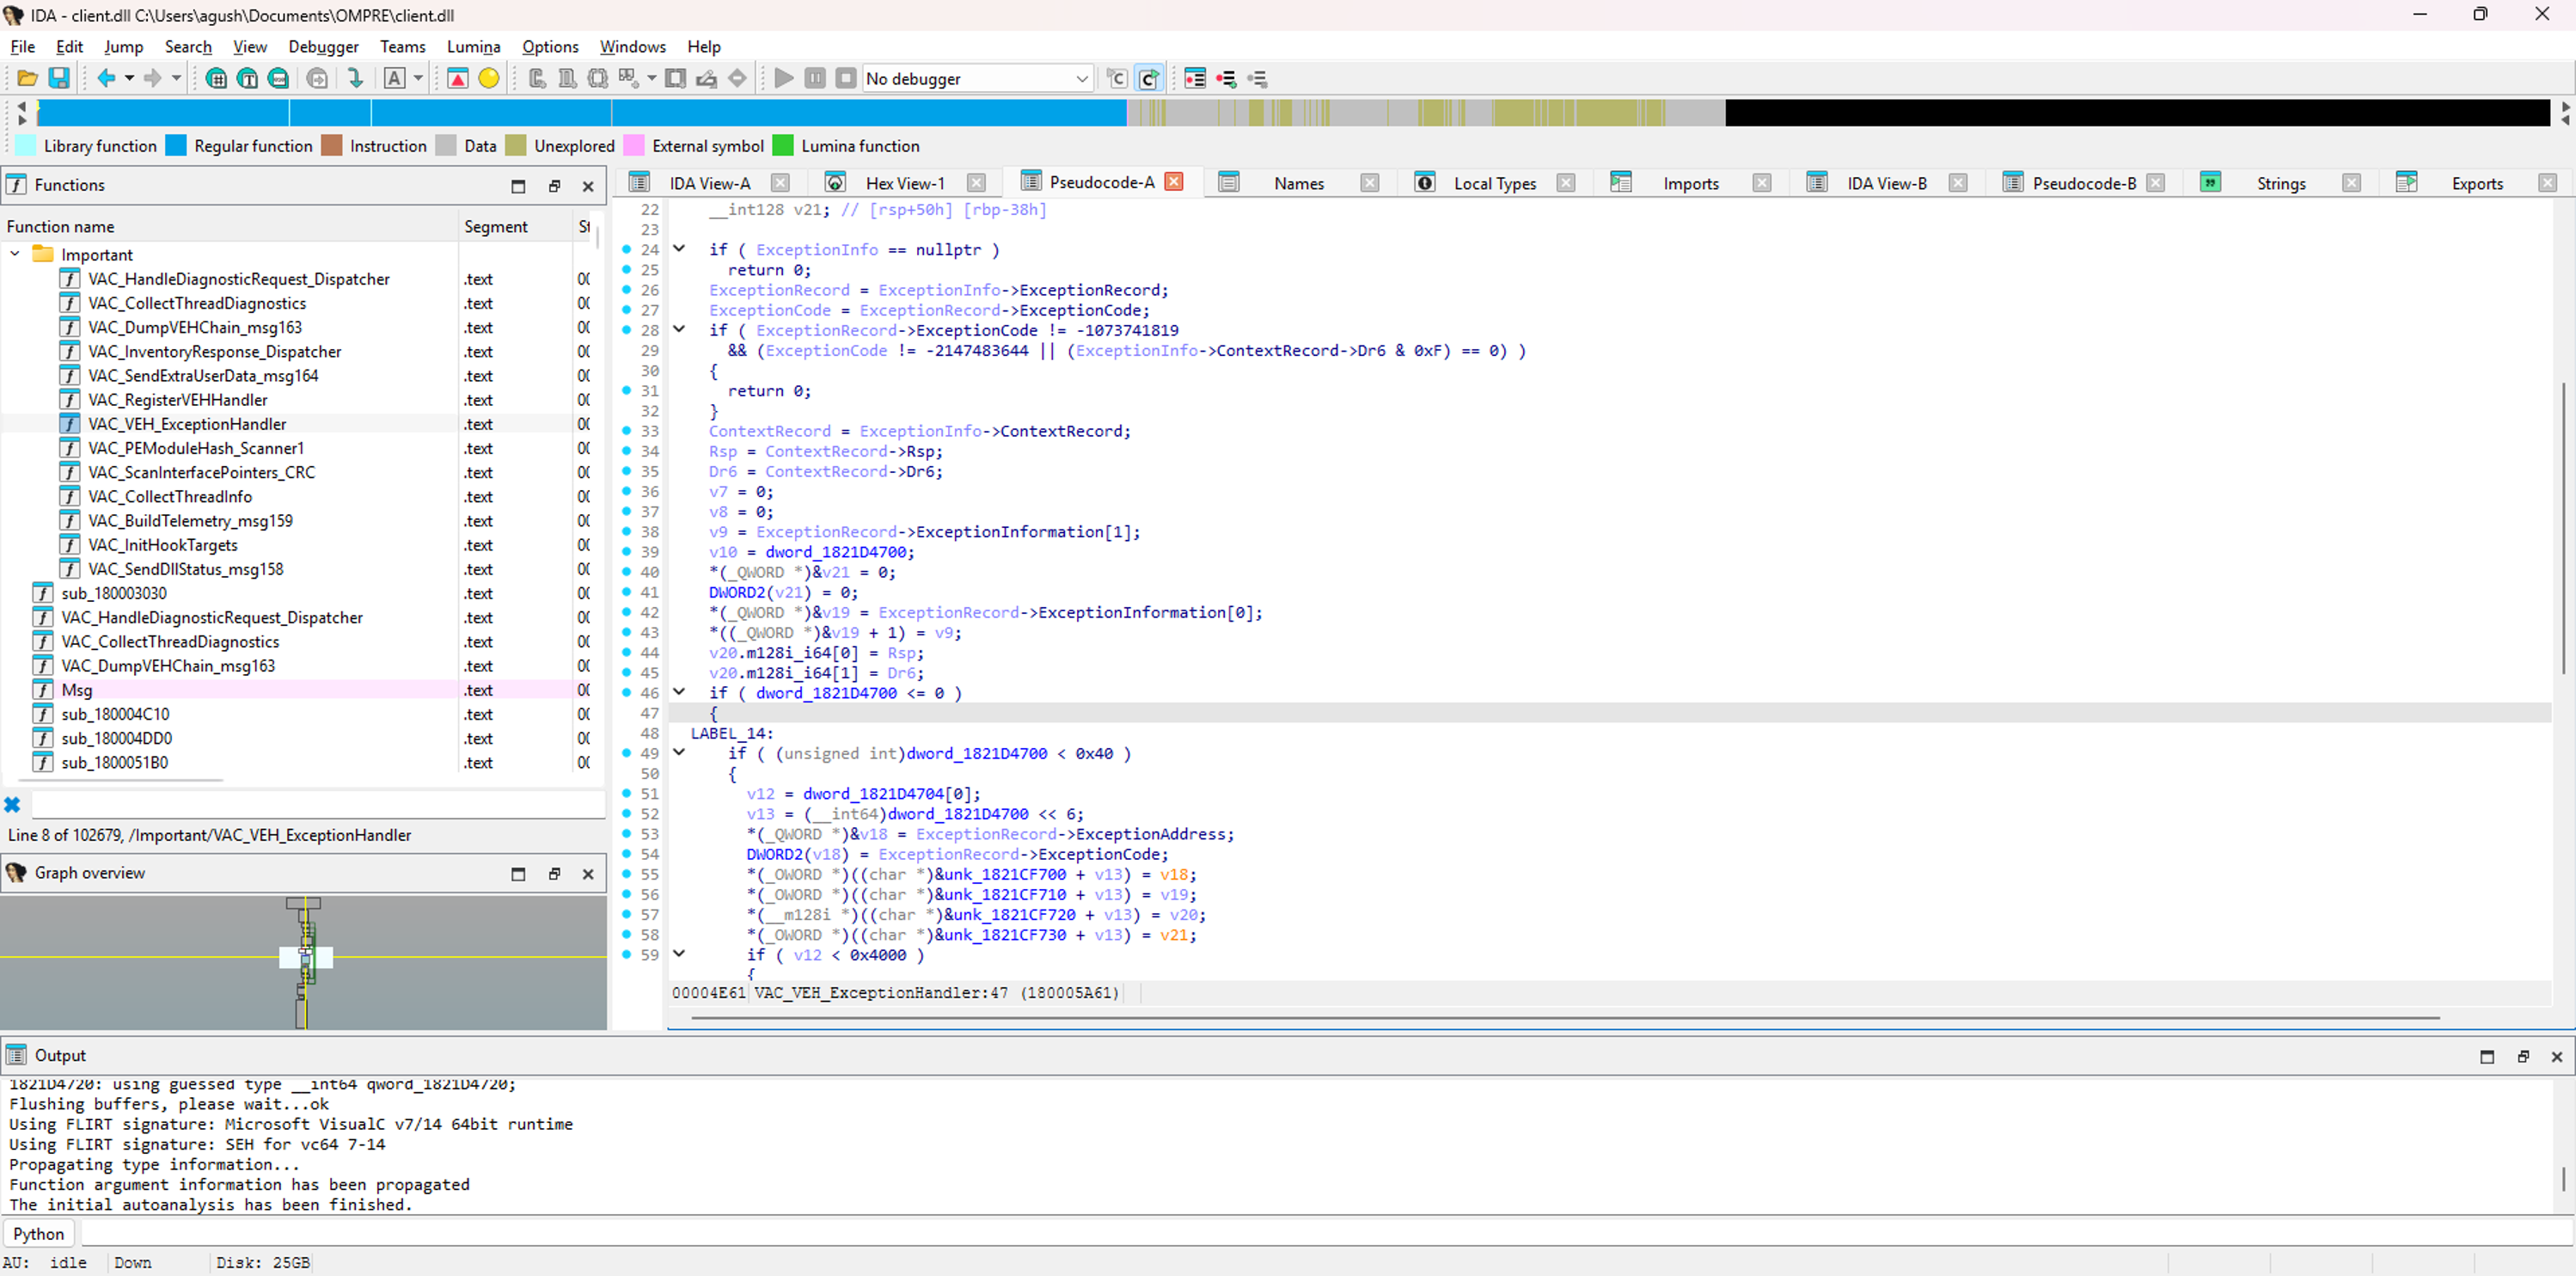
LONG CALLBACK VAC_VEH_ExceptionHandler(EXCEPTION_POINTERS *ep)
{
    if (ep == NULL)
        return EXCEPTION_CONTINUE_SEARCH;

    code = ep->ExceptionRecord->ExceptionCode;

    if (code != STATUS_ACCESS_VIOLATION && code != STATUS_SINGLE_STEP)
        return EXCEPTION_CONTINUE_SEARCH;

    // For single step, check Dr6 to confirm it was a hardware BP
    if (code == STATUS_SINGLE_STEP)
    {
        dr6 = ep->ContextRecord->Dr6;
        if ((dr6 & 0xF) == 0)
            return EXCEPTION_CONTINUE_SEARCH;  // not from DR0-DR3
    }

    faultAddr = ep->ExceptionRecord->ExceptionAddress;
    excCode = code;
    readWrite = ep->ExceptionRecord->ExceptionInformation[0];
    accessAddr = ep->ExceptionRecord->ExceptionInformation[1];
    rsp = ep->ContextRecord->Rsp;
    dr6 = ep->ContextRecord->Dr6;

    // Deduplication check against existing ring buffer entries
    if (isDuplicate(faultAddr, excCode, readWrite, accessAddr, rsp, dr6))
        goto skip;

    // Ring buffer insert
    if (g_ExceptionSlotCount < 0x40)  // 64 slots max
    {
        slot = &ExceptionRingBuffer[g_ExceptionSlotCount * 64];
        slot->ExceptionAddress = faultAddr;
        slot->ExceptionCode = excCode;
        slot->ExInfo[0] = readWrite;
        slot->ExInfo[1] = accessAddr;
        slot->Rsp = rsp;
        slot->Dr6 = dr6;

        // Stack dump: copy from RSP, max 2944 bytes, 8 byte aligned
        bound = 4096 - (rsp & 0xFFF);
        if (bound > 2944)
            bound = 2944;
        copySize = bound & 0xFF8;

        if (g_StackDumpOffset < 0x4000)
        {
            memcpy(&StackDumpBuffer[g_StackDumpOffset], (void*)rsp, copySize);
            slot->StackDumpPtr = &StackDumpBuffer[g_StackDumpOffset];
            slot->StackDumpSize = copySize;
        }

        _InterlockedExchange(&g_ExceptionSlotCount, g_ExceptionSlotCount + 1);
    }

skip:
    // Self heal: if AV inside client.dll .text, restore page protection
    if (code == STATUS_ACCESS_VIOLATION && faultAddr >= clientDllStart && faultAddr <= clientDllEnd)
    {
        Plat_VirtualProtect(faultAddr, 4096, PAGE_EXECUTE_READ);
    }

    // Set Trap Flag to single step next instruction
    ep->ContextRecord->EFlags |= 0x10000;

    return EXCEPTION_CONTINUE_EXECUTION;
}
Let me explain every important part of this code.
Part 1: Filtering Exceptions
if (ep == NULL)
    return EXCEPTION_CONTINUE_SEARCH;

code = ep->ExceptionRecord->ExceptionCode;

if (code != STATUS_ACCESS_VIOLATION && code != STATUS_SINGLE_STEP)
    return EXCEPTION_CONTINUE_SEARCH;
VAC only cares about two types of exceptions. Everything else is ignored.
STATUS_ACCESS_VIOLATION is hex 0xC0000005. This happens when code tries to access memory it does not have permission to read or write. In decimal this is -1073741819.
STATUS_SINGLE_STEP is hex 0x80000004. This happens when a hardware breakpoint fires or when the CPU Trap Flag is set.
If the exception is anything else VAC returns EXCEPTION_CONTINUE_SEARCH which tells Windows "I did not handle this, let the next handler try."
Part 2: Hardware Breakpoint Detection
if (code == STATUS_SINGLE_STEP)
{
    dr6 = ep->ContextRecord->Dr6;
    if ((dr6 & 0xF) == 0)
        return EXCEPTION_CONTINUE_SEARCH;
}
A single step exception can happen for two different reasons:
- Hardware breakpoint. The CPU has special registers called DR0, DR1, DR2, DR3 (Debug Registers). You can set an address in one of them and tell the CPU to stop execution when that address is accessed. When the breakpoint triggers, the CPU sets the corresponding bit in DR6 (DR6 bit 0 for DR0, bit 1 for DR1, etc).
- Trap Flag. The EFLAGS register has a bit called the Trap Flag (TF) at bit 8. When this flag is set, the CPU triggers a single step exception after every instruction. This is used by debuggers to step through code one instruction at a time.
VAC checks Dr6 & 0xF. If any of the lower 4 bits are set, it means a hardware breakpoint caused the exception. If they are all zero, it means the Trap Flag caused it (or something else) and VAC ignores it.
This is how VAC detects hardware breakpoints. If a cheat sets DR0 on a VAC function to intercept calls, the single step exception will have Dr6 bit 0 set, and VAC will catch it.
Part 3: Extracting Exception Information
faultAddr = ep->ExceptionRecord->ExceptionAddress;
excCode = code;
readWrite = ep->ExceptionRecord->ExceptionInformation[0];
accessAddr = ep->ExceptionRecord->ExceptionInformation[1];
rsp = ep->ContextRecord->Rsp;
dr6 = ep->ContextRecord->Dr6;
This collects all the relevant data:
faultAddr: The address where the exception happened (where the CPU was executing)excCode: The exception type codereadWrite: For access violations, this is 0 for a read or 1 for a writeaccessAddr: For access violations, this is the address that was being accessedrsp: The stack pointer at the time of the exceptiondr6: The debug register status
Part 4: Deduplication
if (isDuplicate(faultAddr, excCode, readWrite, accessAddr, rsp, dr6))
    goto skip;
Before adding to the ring buffer, VAC checks if the exact same exception was already recorded. It compares all six values against existing entries. If they all match, it skips the insert.
This prevents the ring buffer from filling up with the same repeating exception. Imagine a hardware breakpoint on a function that gets called thousands of times per second. Without deduplication the buffer would fill in milliseconds.
Part 5: The Ring Buffer
if (g_ExceptionSlotCount < 0x40)  // 64 slots max
{
    slot = &ExceptionRingBuffer[g_ExceptionSlotCount * 64];
    slot->ExceptionAddress = faultAddr;
    slot->ExceptionCode = excCode;
    slot->ExInfo[0] = readWrite;
    slot->ExInfo[1] = accessAddr;
    slot->Rsp = rsp;
    slot->Dr6 = dr6;
The ring buffer is stored at a global address I found: 0x1821CF700. It holds up to 64 entries. Each entry is 64 bytes.
The structure of each entry is:
Offset 0: ExceptionAddress (8 bytes) - where it happened
Offset 8: ExceptionCode (4 bytes) - what type
Offset 12: R/W flag (4 bytes) - read or write
Offset 16: AccessAddress (8 bytes) - what was being accessed
Offset 24: RSP (8 bytes) - stack pointer
Offset 32: Dr6 (4 bytes) - debug status
Offset 36: (4 bytes padding)
Offset 40: StackDumpPtr (8 bytes) - pointer to stack data
Offset 48: StackDumpSize (4 bytes) - how much stack was copied
Offset 52: (12 bytes padding)
Total: 64 bytes
Part 6: Stack Dump
bound = 4096 - (rsp & 0xFFF);
if (bound > 2944)
    bound = 2944;
copySize = bound & 0xFF8;

if (g_StackDumpOffset < 0x4000)
{
    memcpy(&StackDumpBuffer[g_StackDumpOffset], (void*)rsp, copySize);
    slot->StackDumpPtr = &StackDumpBuffer[g_StackDumpOffset];
    slot->StackDumpSize = copySize;
}
This is interesting. VAC copies raw stack data from the point where the exception happened.
The calculation works like this:
rsp & 0xFFFgets the offset within the current memory page (4KB = 0x1000)4096 - offsetgives the remaining space in the current page- If this is more than 2944, cap it at 2944
- Then align down to 8 bytes (
& 0xFF8)
Why 2944? 4096 - 2944 = 1152 which is enough room for the exception information structure. VAC does not want to cross a page boundary because the next page might not be mapped, causing another exception.
The stack dump is stored in a separate 16KB buffer at 0x1821D0700. Each entry points to its portion of this buffer. The 16KB buffer can hold stack dumps for all 64 entries, with each entry averaging 256 bytes (though individual entries can use up to 2944 bytes).
The stack counter g_StackDumpOffset at 0x1821D4704 tracks the current write position in the 16KB buffer. When the buffer is full (offset >= 0x4000), stack dumps are no longer recorded.
Part 7: Self Healing
if (code == STATUS_ACCESS_VIOLATION
    && faultAddr >= clientDllStart
    && faultAddr <= clientDllEnd)
{
    Plat_VirtualProtect(faultAddr, 4096, PAGE_EXECUTE_READ);
}
This is the self healing mechanism. If an access violation happens inside VAC own code (client.dll .text section), VAC does not just log it. It restores the page protection to PAGE_EXECUTE_READ (0x05).
Here is how VAC determines the bounds:
// I found this pattern in the decompilation
if (MEMORY[IMAGE_BASE] == 0x5A4D)  // 'MZ' signature check
    moduleEnd = IMAGE_BASE + *(uint32_t*)(IMAGE_BASE + 0x3C + IMAGE_BASE + 0x1C);
// This walks the PE header to get the SizeOfImage
It reads the PE header to find where client.dll ends, then checks if the fault address falls within that range.
Why does VAC do this?
Imagine a cheat tries to page guard one of VAC functions. The cheat marks the page as PAGE_NOACCESS. When a VAC function is called, the CPU triggers an access violation. The cheat VEH handler expects to catch this, run its hook code, and then let the function continue.
But VAC registered its VEH handler at priority 1 (highest). So VAC handler gets the exception FIRST. It sees the access violation, determines it is inside client.dll .text, and calls Plat_VirtualProtect to restore the page to executable. Then it lets the exception continue.
The cheat VEH handler never even sees the exception because VAC handled it first and told Windows to continue execution.
Part 8: Trap Flag
ep->ContextRecord->EFlags |= 0x10000;After dealing with the exception, VAC sets the Trap Flag (bit 16) in the EFLAGS register. This means the CPU will trigger a STATUS_SINGLE_STEP exception after the next instruction executes.
Why set the Trap Flag?
After VAC restores page protection, the CPU is about to resume execution at the instruction that caused the access violation. VAC sets the Trap Flag so it can single-step through that instruction and catch any follow-up issues. If the same instruction causes another problem, VAC will see it through the single step exception.
The Ring Buffer Globals
Here are the exact global addresses I found for the ring buffer:
| Address | Size | Purpose |
|---|---|---|
0x1821D4700 | 4 bytes | Exception slot count (how many entries used, max 0x40) |
0x1821D4704 | 4 bytes | Stack dump offset (current write position, max 0x4000) |
0x1821CF700 | 4096 bytes | Ring buffer data (64 slots * 64 bytes) |
0x1821D0700 | 16384 bytes | Stack dump data (64KB total) |
The ring buffer is flushed when:
- The server sends Case 27 which does
_InterlockedExchange(&g_ExceptionSlotCount, 0) - The data is sent to the server as part of message 163
The Server Command Handler
This is what surprised me the most. There is a function at 0x180003140 that receives commands from the game server and executes them. It is the largest VAC function at 0x13D6 bytes.
The dispatcher processes a list of commands. Each command has:
- A command type (int at offset +68 within the command structure)
- A calling convention (int at offset +56)
- Various parameters like addresses, sizes, and thread IDs
The outer loop increments a counter v130 as it processes each entry. When all commands are done, it sends the response as message 163.
Case 23: Call Function Pointer
case 23:
    // The server previously wrote to qword_1821D4718 via Case 30
    fn = g_ServerFunctionPointer;

    if (convention == 1)
        fn();                              // no arguments
    else if (convention == 2)
        fn(this, arg);                     // thiscall
    else if (convention == 3)
    {
        buffer = CUtlBuffer::Alloc(size);  // buffer based call
        fn(buffer, size, param);
        CUtlBuffer::Free(buffer);
    }
    else if (convention == 4)
        result = fn(arg1, arg2, &outResult);  // returns result
This lets the server call any function in the game process. The function pointer is set by Case 30 which writes to global variables qword_1821D4718 (at 0x1821D4718) and qword_1821D4720.
The function must pass Control Flow Guard (CFG) validation. CFG is a Windows security feature that checks call targets against a whitelist of valid indirect call targets. But there are still many functions in the process that are valid CFG targets.
Case 26: Dump Thread Debug Registers
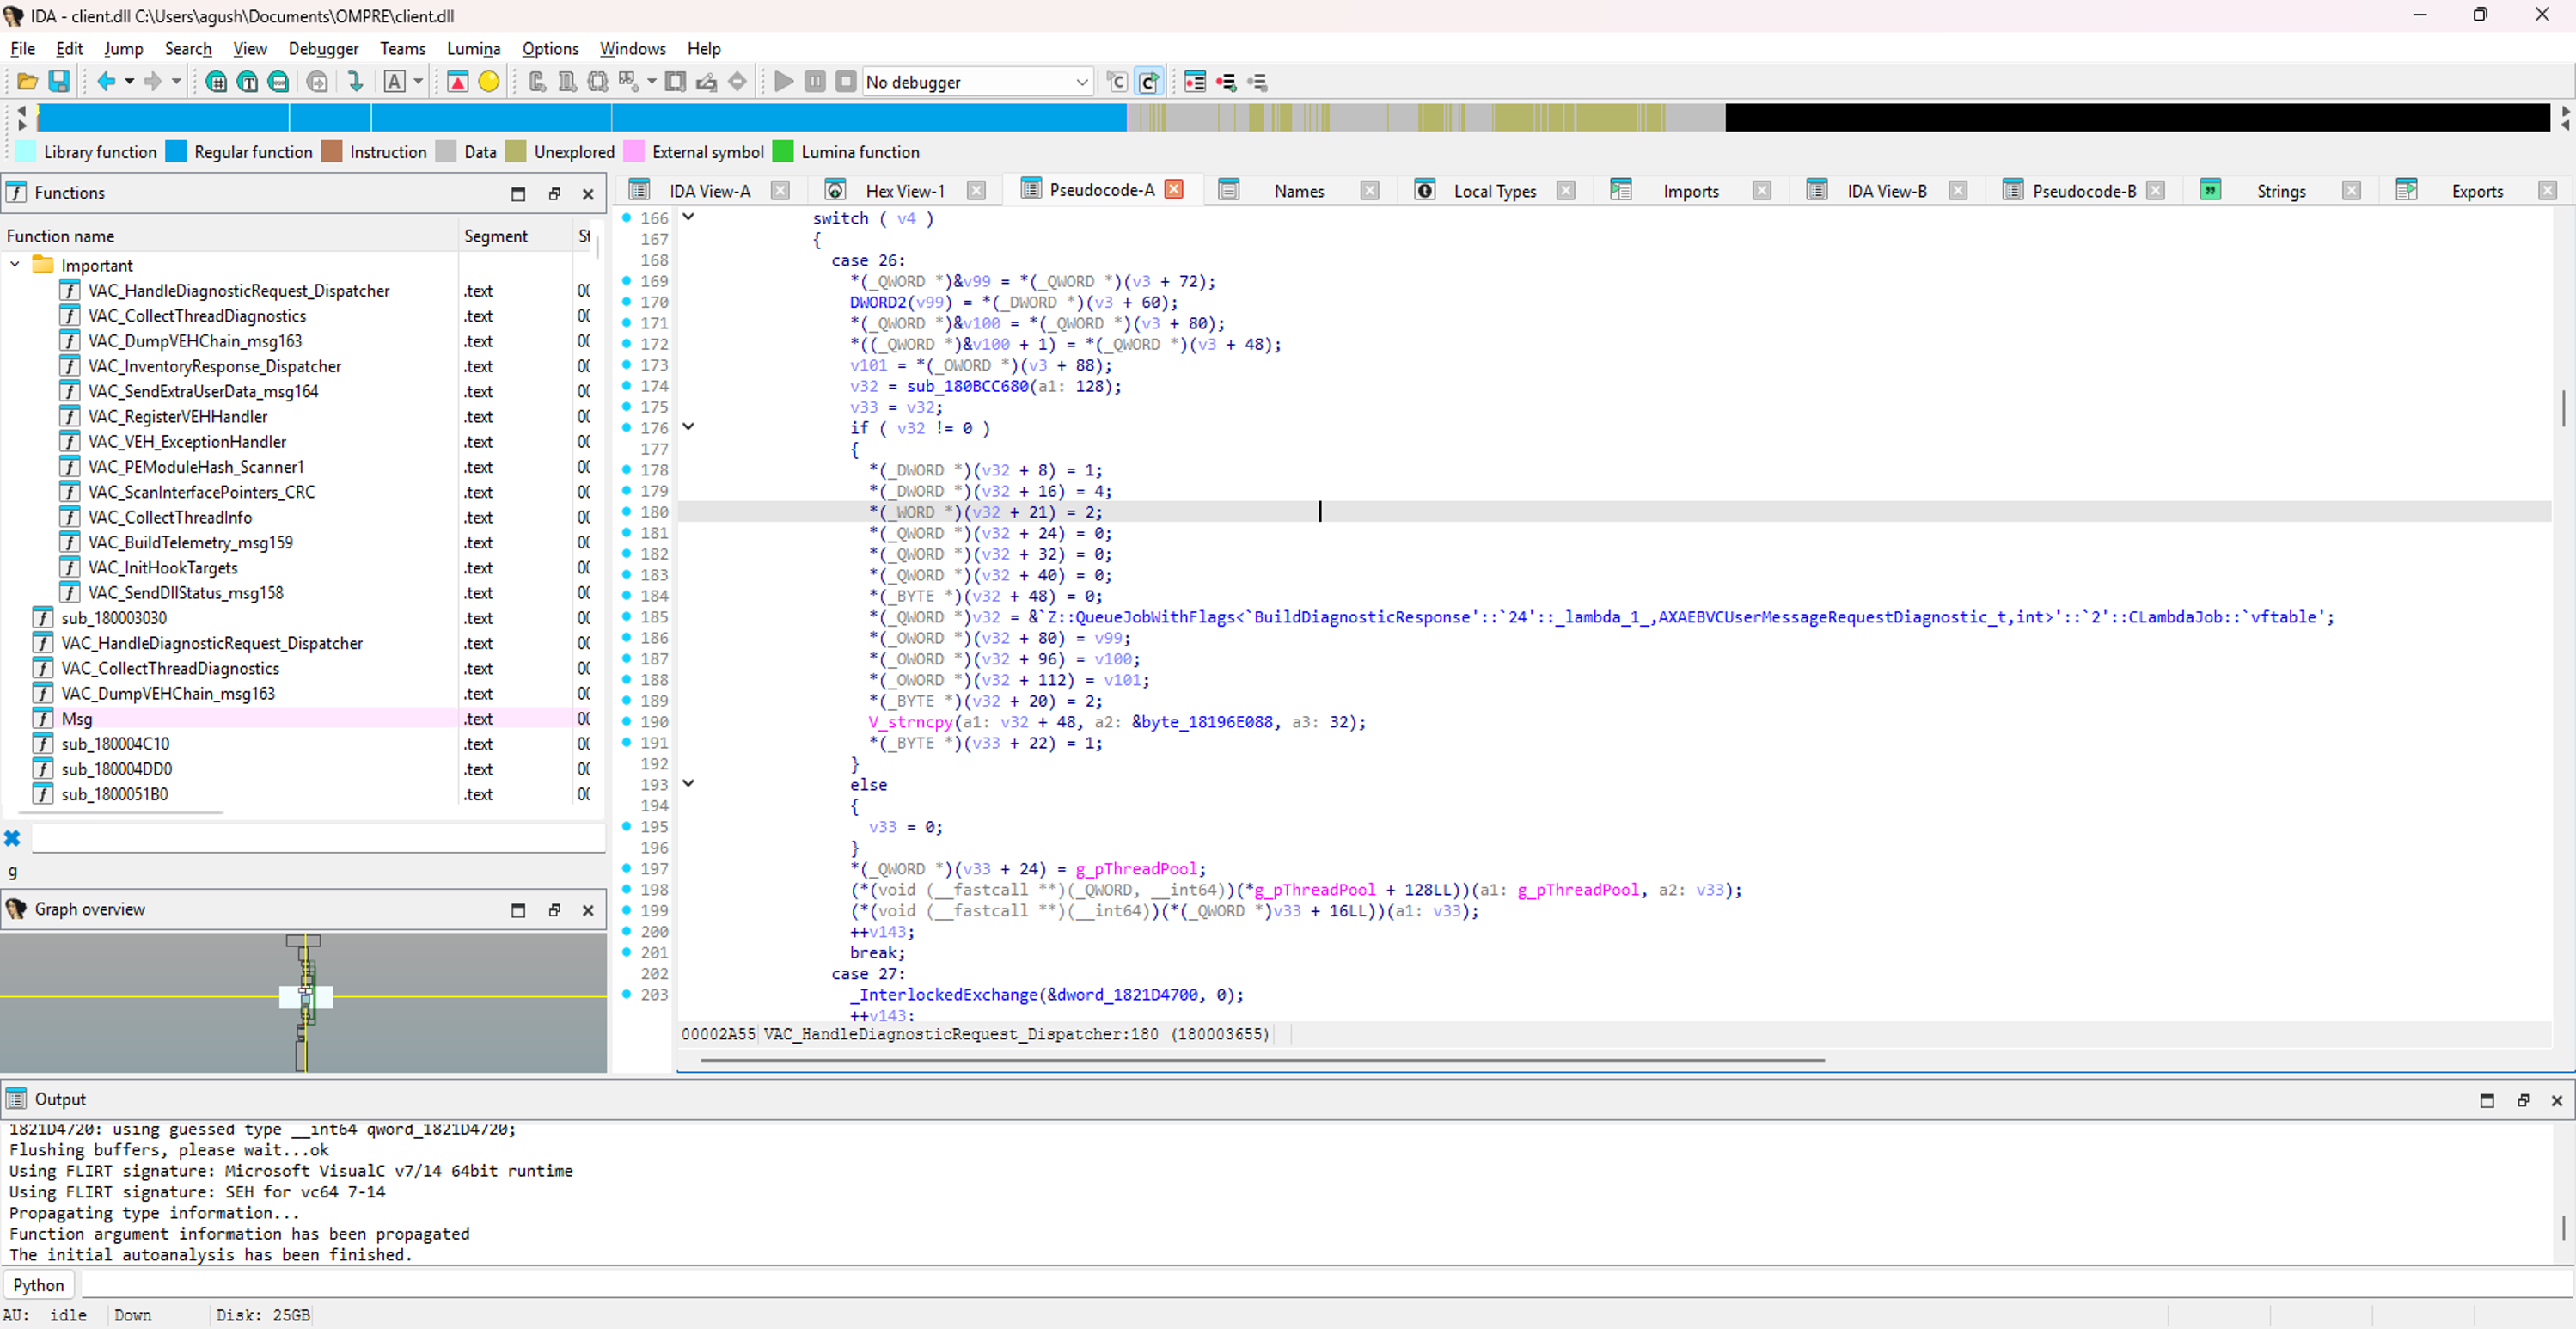
case 26:
    tid = cmd->threadId;                    // server specifies which thread

    hThread = OpenThread(THREAD_ALL_ACCESS, FALSE, tid);
    SuspendThread(hThread);

    ctx.ContextFlags = CONTEXT_ALL;
    GetThreadContext(hThread, &ctx);

    // Reports to server:
    // DR0, DR1, DR2, DR3, DR7, RSP, RIP
This lets the server check any thread for hardware breakpoints. The server provides a thread ID, and VAC opens that thread with full access, suspends it, and reads its context including all debug registers.
If a cheat set a hardware breakpoint (DR0-DR3) on the render thread or any game thread, this command catches it. The server can target specific threads by ID.
Case 27: Reset Exception Ring Buffer
case 27:
    _InterlockedExchange(&g_ExceptionSlotCount, 0);
    break;
Clears the 64 entry exception ring buffer. Used after the server has consumed the exception data so that fresh exceptions can be recorded.
Case 28: Read Arbitrary Memory
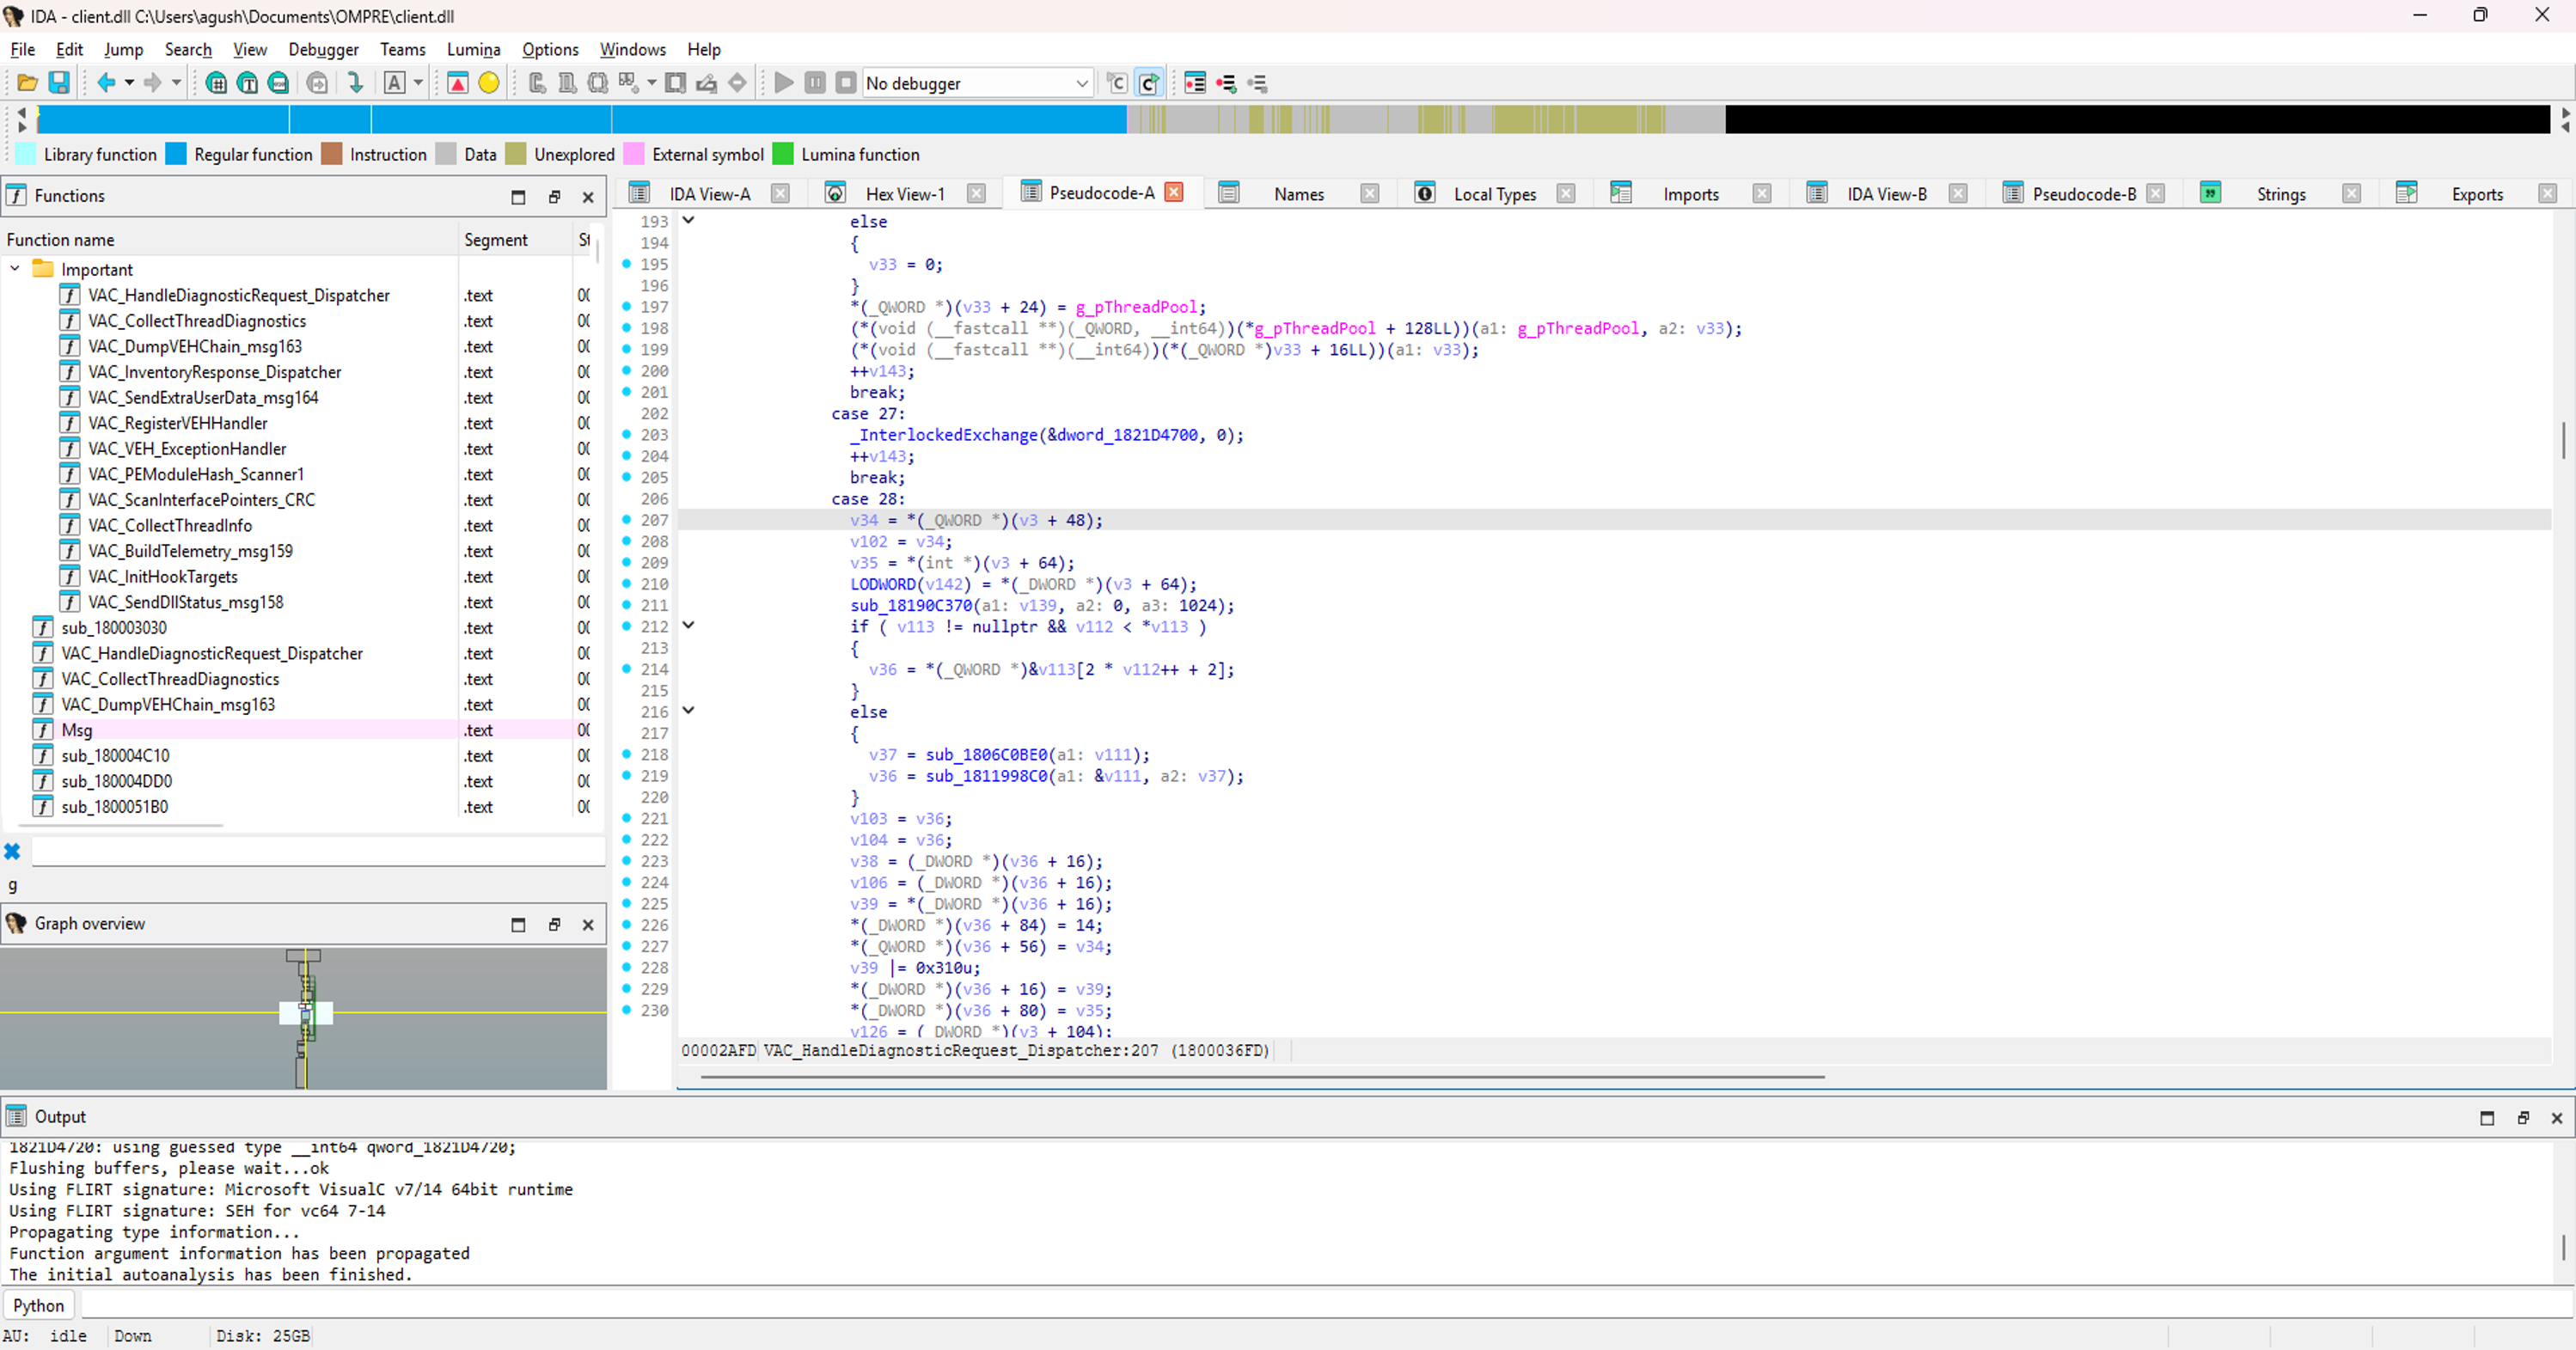
case 28:
    addr = cmd->address;                     // server provides address
    size = cmd->size;                        // server provides size

    if (size > 0x400)                        // limit: 1024 bytes
    {
        // Large buffer path
        memcpy(buf, addr, size);
        SendAsString(buf, size);
    }
    else
    {
        // Small buffer path
        memcpy(buf, addr, size);
        SendAsString(buf, size);
    }
I found the size limit at address 0x1800037D6 in the decompilation:
if (v35 > 0x400) /*0x1800037d6*/0x400 is 1024. The server can read up to 1024 bytes from any address in the game process. There is no validation on the address. The server can read anything.
What does this mean?
The server can:
- Read any cheat memory if it knows the address
- Read VAC own memory to verify its integrity
- Read game entity lists to cross reference
- Read any module headers to verify signatures
- Read stack memory of any thread
The 1024 byte limit per request means reading a large amount takes many requests. But there is no limit on the number of requests.
Case 29: Probe Exported Function
case 29:
    moduleName = cmd->moduleName;            // module name string
    exportName = cmd->exportName;            // export name string
    readSize = cmd->size;                    // how many bytes to read

    hMod = GetModuleHandleA(moduleName);     // find the module
    fn = GetProcAddress(hMod, exportName);   // find the export

    if (fn && readSize > 0)
    {
        memcpy(buf, fn, readSize);           // read the first N bytes
        SendResult(buf, readSize);
    }

    SendLastError(GetLastError());
This lets the server read the first N bytes of any exported function in any loaded DLL. The server can check if a function starts with expected bytes or if it has been hooked with a JMP instruction.
The server also receives GetLastError() which helps diagnose if the module or export was not found.
Case 30: Plant Function Pointers
case 30:
    qword_1821D4718 = cmd->value1;           // function pointer 1
    qword_1821D4720 = cmd->value2;           // function pointer 2
    break;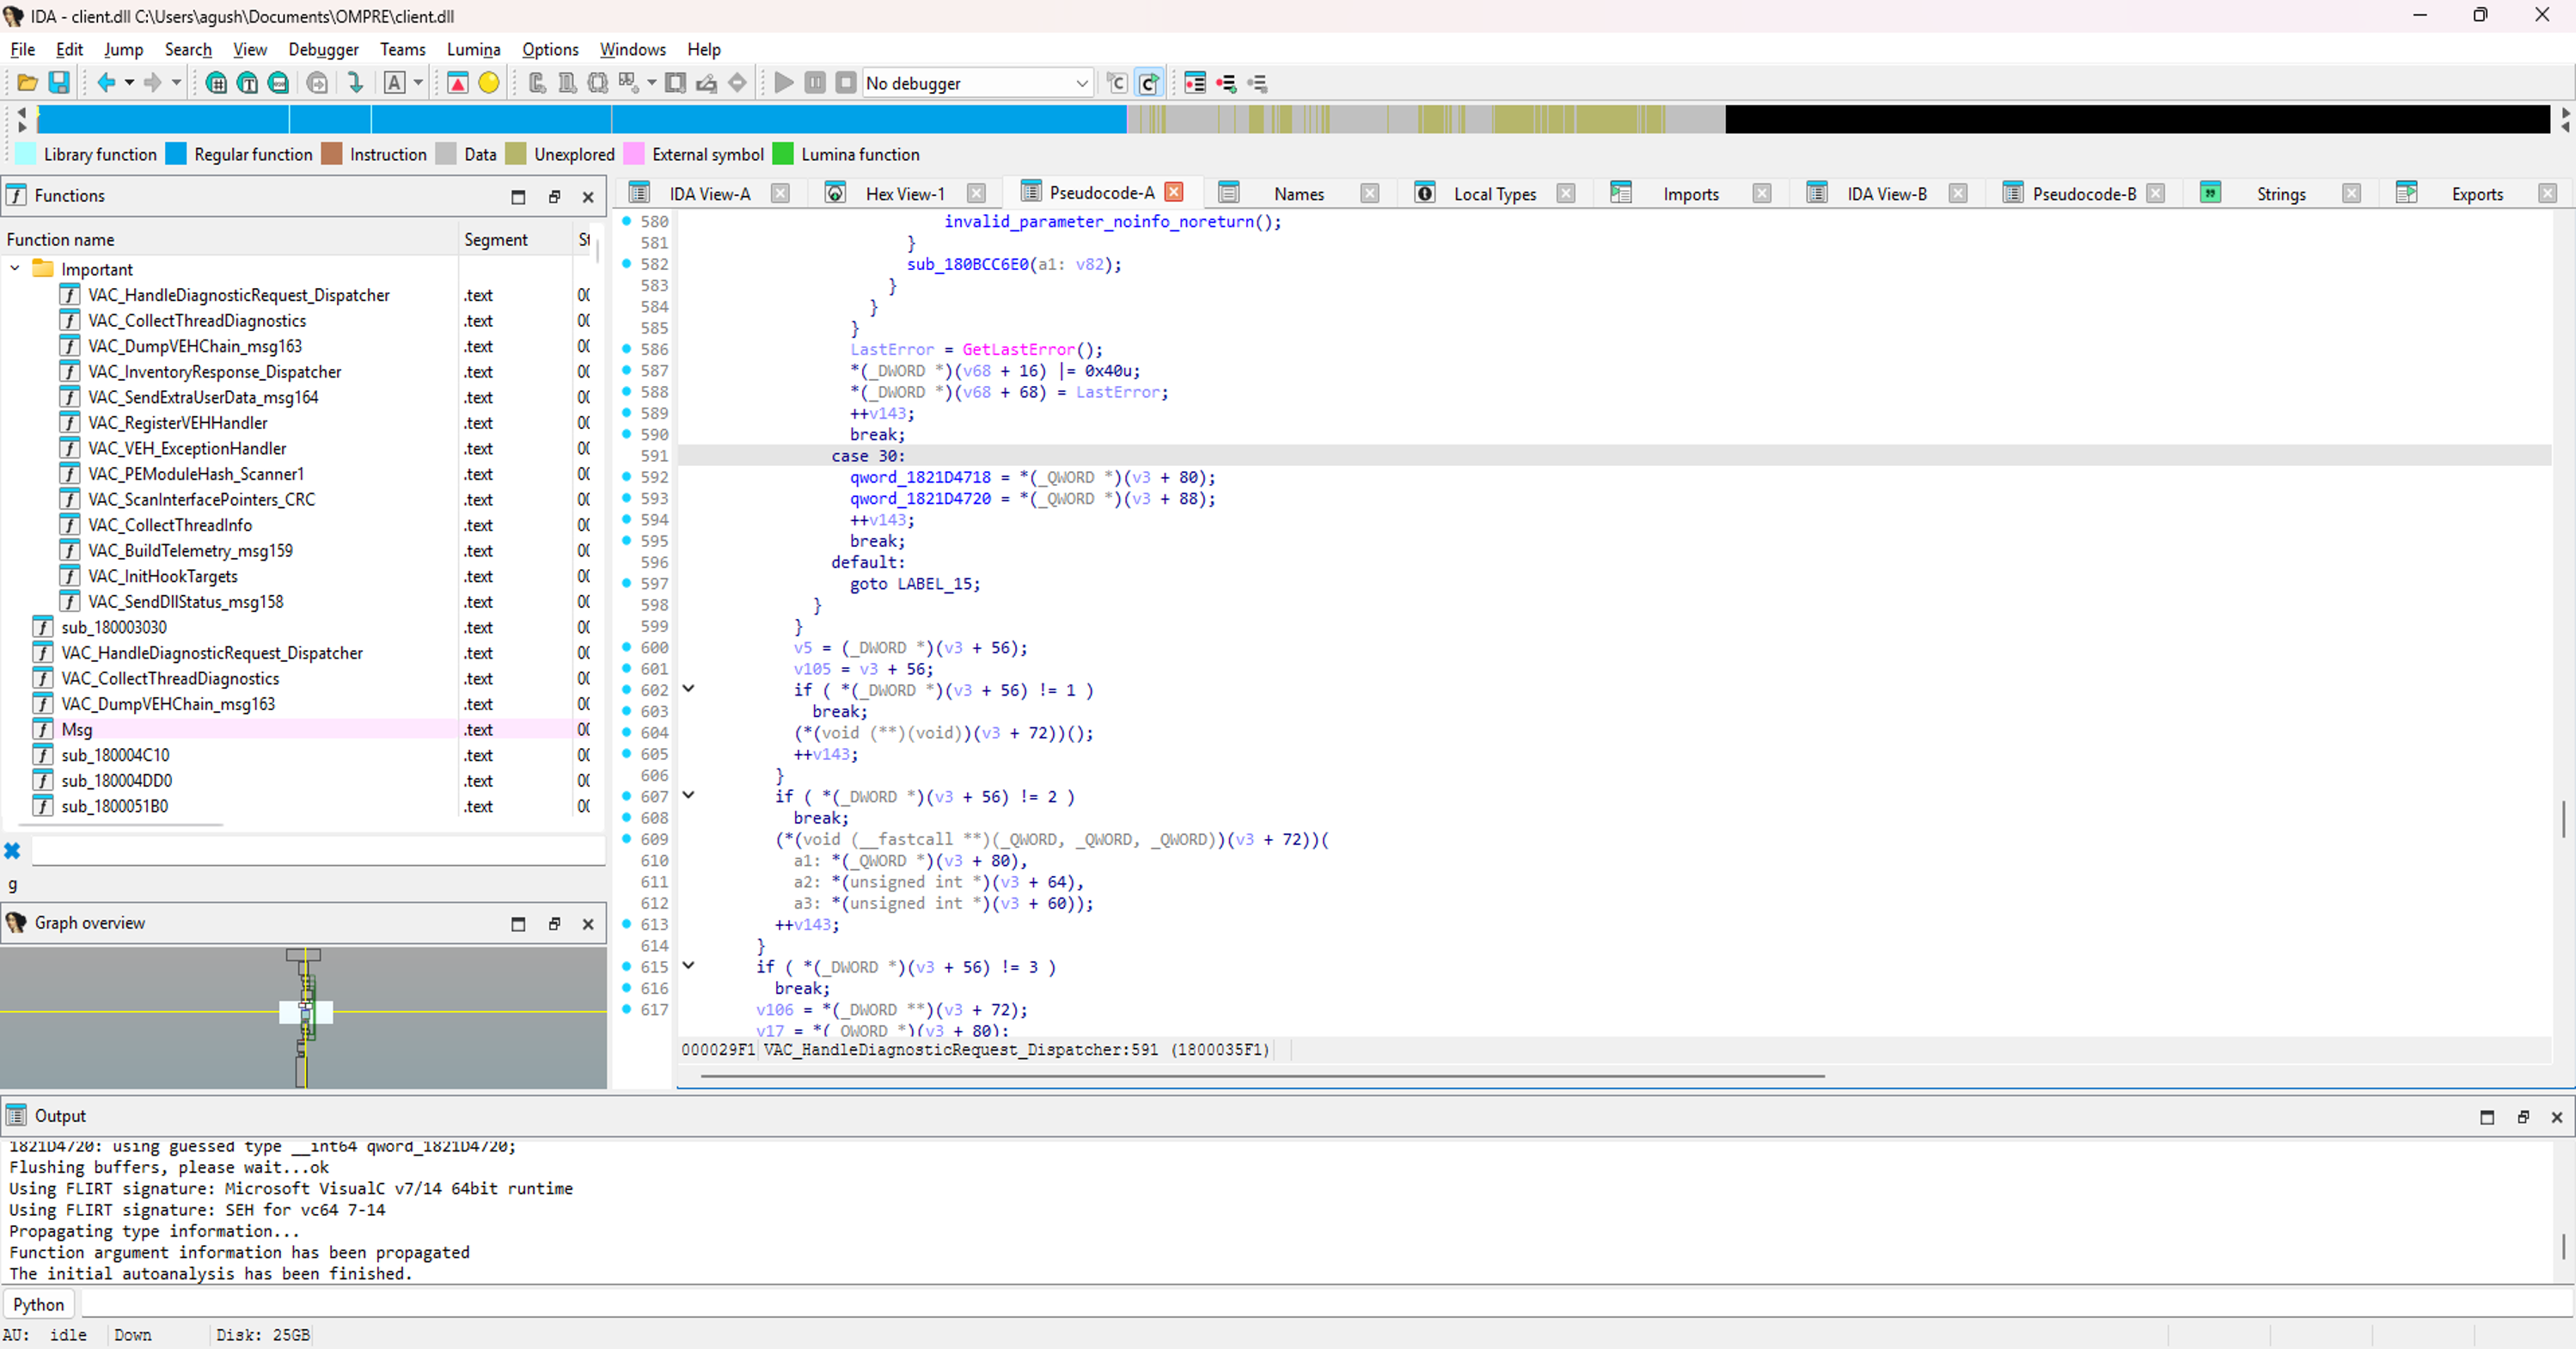
These two globals at 0x1821D4718 and 0x1821D4720 are later used by Case 23 as call targets. The server writes arbitrary QWORD values into VAC global state, then can call them as functions through Case 23.
The Telemetry Function
VAC_BuildTelemetry_msg159 at 0x180153390 is massive. It collects 40+ fields and sends them as message 159 when you first connect to a server.
void VAC_BuildTelemetry_msg159(Context *ctx, Message *msg, CUtlBuffer *buf, uint8_t flag)
{
    // Take a snapshot of all loaded modules
    CModuleListSnapshot snapshot;
    snapshot.Capture(GetCurrentProcessId());
    while (snapshot.GetNextModule(&name, &path, &base, &size))
    {
        AddModuleToReport(msg, name, base, size);
    }

    // Prepare a 100KB buffer for BSecureAllowed violation string
    CUtlBuffer::EnsureCapacity(buf, 102400);
    violationBuffer = buf->GetPtr(102400);

    // Call the engine collector functions
    if (ctx->collectorFn1 && ctx->collectorFn2 && ctx->collectorFn3 && ctx->collectorFn4)
    {
        val1 = ctx->collectorFn1();           // field 21
        val2 = ctx->collectorFn2();           // field 22
        val3 = ctx->collectorFn3();           // field 23
        bsa = ctx->collectorFn4(violationBuffer, 102400, flag);

        if (ctx->bInsecureFlag)
            bsa = 0;
    }

    // Get command line
    cmdline = CommandLine()->GetCmdLine();     // field 28

    // Process and thread IDs
    AddField(msg, 24, GetCurrentProcessId());  // PID

    AddField(msg, 25, GetCurrentThreadId());   // main thread TID
    // ... later ...
    AddField(msg, 34, GetCurrentThreadId());   // same TID again
I want to point out something interesting here.
Fields 25 and 34 both call GetCurrentThreadId(). They are the same value. The server receives the main thread TID twice. This might be a bug or it might be intentional redundancy. Either way, the main thread TID is the only thread identifier the server ever receives for the process.
    // Module handles
    hClient = GetModuleHandleA(NULL);           // client.dll
    GetModuleHandleExA(0x6, ctx->someFunction, &hCs2);  // cs2.exe

    AddField(msg, 8, hCs2);
    AddField(msg, 9, ctx->field_96);
    AddField(msg, 10, hClient);
    AddField(msg, 14, ctx->field_112);           // ntdll
    AddField(msg, 38, ctx->field_120);           // gameoverlayrenderer64

    // PE timestamps (TimeDateStamp from PE header)
    AddField(msg, 11, GetTimestamp(hCs2));
    AddField(msg, 12, GetTimestamp(ctx->field_96));  // client.dll?
    AddField(msg, 13, GetTimestamp(hClient));
    AddField(msg, 15, GetTimestamp(ctx->field_112));  // ntdll
    AddField(msg, 39, GetTimestamp(ctx->field_120));  // overlay
The PE timestamps allow the server to verify that the DLLs in the process are the expected versions. If someone replaced client.dll with a modified version the timestamp would be different.
    // Security flags
    AddField(msg, 1, ctx->field_184);
    AddField(msg, 2, ctx->field_192);
    ...

    // Trusted mode flags
    trustedFlags = 0;
    if (qword_1825CD520)
    {
        if (qword_1825CD520->vtable[22]())    // vtable +176
            trustedFlags |= 1;
        if (qword_1825CD520->vtable[25]())    // vtable +200
            trustedFlags |= 2;
    }
    AddField(msg, 33, trustedFlags);

    // OS type
    AddField(msg, 27, Plat_GetOSType());

    // BSecureAllowed result
    AddField(msg, 30, ctx->field_88);

    // IsDebuggerPresent
    AddField(msg, 37, IsDebuggerPresent());

    // CPU info (148 bytes packed into field 40)
    memset(cpuBuf, 0, 148);
    cpuBuf[0] = 148;
    if (ctx->cpuInfoFn)
        ctx->cpuInfoFn(cpuBuf);
    AddField(msg, 40, cpuBuf[3] | (cpuBuf[2] << 16) | (cpuBuf[1] << 24));
}
The IsDebuggerPresent() field at offset 37 checks the PEB BeingDebugged flag. This is easy to bypass by setting PEB->BeingDebugged = 0 or hooking NtQueryInformationProcess.
The CPU info field collects a 148 byte structure from the engine, probably containing CPUID results and processor features. This helps the server identify the hardware.
The Thread Checker
VAC_CollectThreadInfo at 0x180152FA0 is called when a new thread is created through the ConcRT runtime.
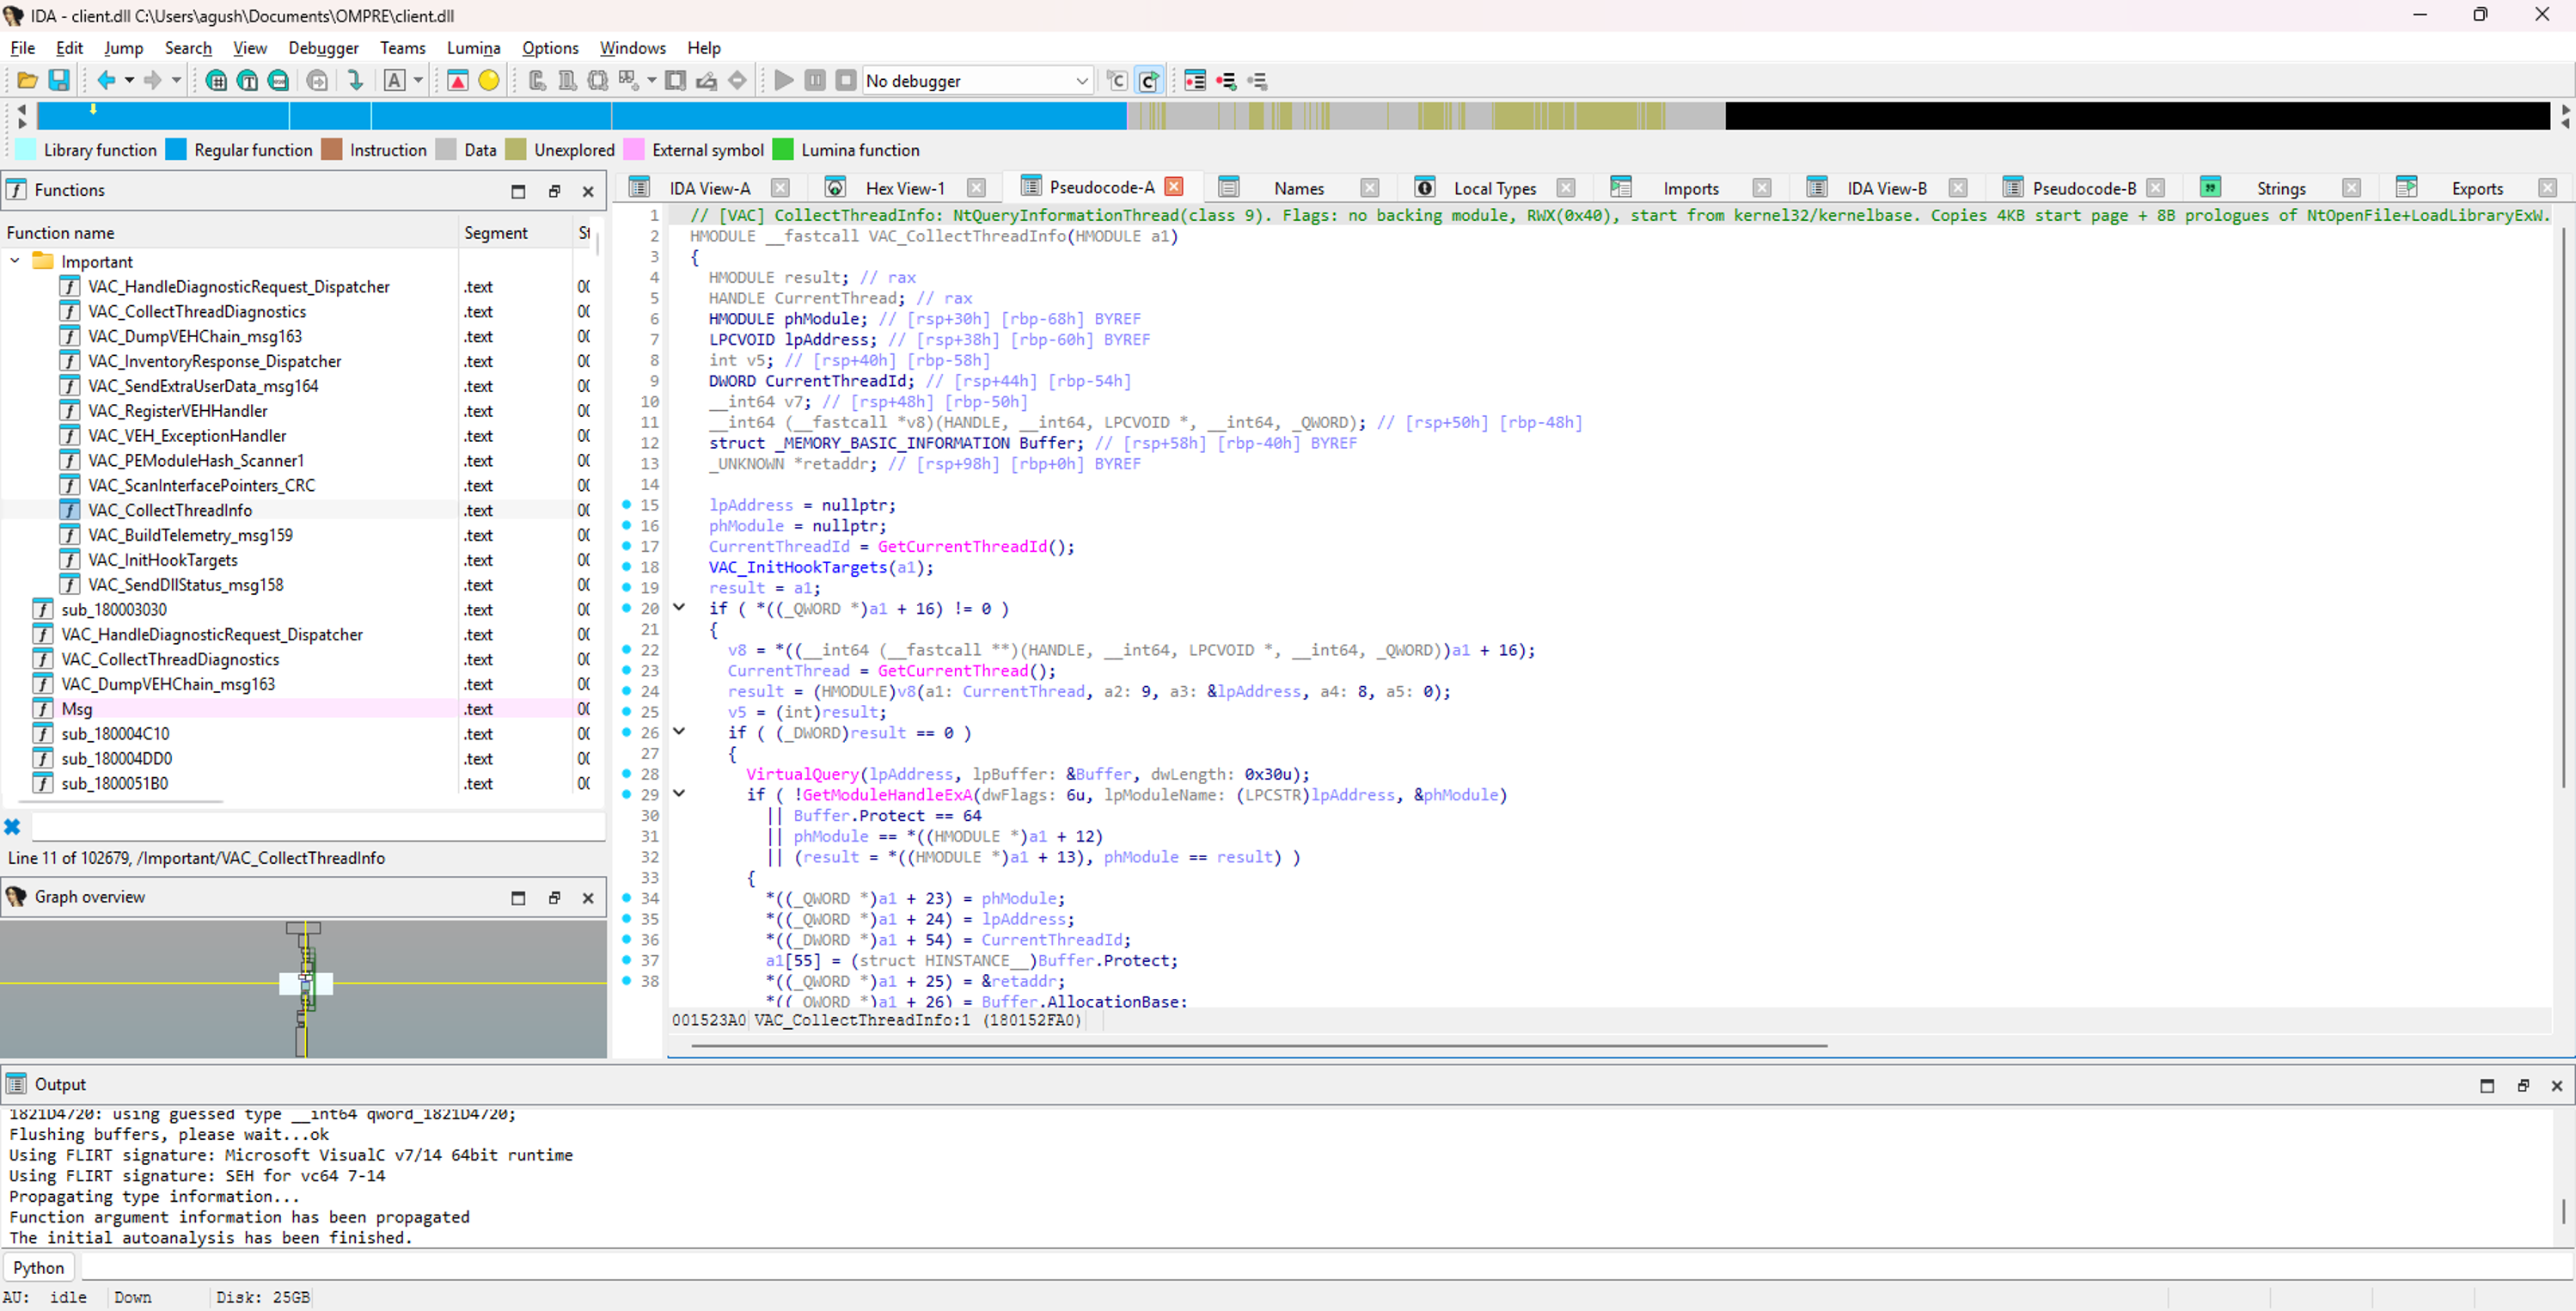
HMODULE VAC_CollectThreadInfo(Context *ctx)
{
    threadStart = NULL;
    module = NULL;
    tid = GetCurrentThreadId();

    VAC_InitHookTargets(ctx);

    if (ctx->NtQueryThread == NULL)
        return NULL;

    // Get thread start address
    status = ctx->NtQueryThread(GetCurrentThread(), 9, &startAddr, 8, NULL);
    if (status != 0)
        return NULL;

    // Check memory protection at start address
    VirtualQuery(startAddr, &mbi, sizeof(mbi));

    // Find backing module
    GetModuleHandleExA(0x6, startAddr, &hMod);

    // SUSPICIOUS IF:
    bool suspicious = !hMod                              // no backing module
                   || mbi.Protect == PAGE_EXECUTE_READWRITE  // RWX memory
                   || hMod == ctx->kernel32                  // from kernel32
                   || hMod == ctx->kernelbase;               // from kernelbase

    if (suspicious)
    {
        ctx->suspiciousModule = hMod;
        ctx->suspiciousStartAddr = startAddr;
        ctx->threadId = tid;
        ctx->protection = mbi.Protect;
        ctx->returnAddress = __builtin_return_address(0);

        // Copy 4KB of the thread start page
        pageStart = (void*)((uint64_t)startAddr & ~0xFFF);
        memcpy(ctx->threadStartPage, pageStart, 4096);

        // Copy first 8 bytes of NtOpenFile and LoadLibraryExW
        memcpy(ctx->ntOpenFile_prologue, ctx->pNtOpenFile, 8);
        memcpy(ctx->loadLibraryExW_prologue, ctx->pLoadLibraryExW, 8);

        ctx->suspiciousCount++;
    }
}
What makes a thread suspicious according to VAC?
| Condition | What It Means |
|---|---|
| No backing module (hMod == NULL) | The thread start address is in memory that no DLL owns. This is typical of manual mapped cheat code |
| PAGE_EXECUTE_READWRITE (0x40) | Normal code is PAGE_EXECUTE_READ (0x20). If the memory is also writable (RWX), it means the memory was dynamically allocated and made executable. Cheat code is often in RWX memory |
| Backed by kernel32.dll | Someone called CreateRemoteThread pointing to a kernel32 function like LoadLibrary. The thread appears to start from kernel32 which is suspicious |
| Backed by kernelbase.dll | Same as above but for kernelbase |
The 4KB copy: When a suspicious thread is detected, VAC copies the entire 4KB page containing the thread start address. This is a snapshot of the code that the thread is running. The server can analyze this to understand what the thread does.
The 8 byte prologue copies: VAC also copies the first 8 bytes of NtOpenFile and LoadLibraryExW. These are later compared against the live bytes of those functions. If the live bytes differ from the snapshot, it means those functions were hooked after the snapshot was taken.
But here is the critical limitation: This function only runs on THREAD_ATTACH events. If a cheat does NOT create a new thread but instead hijacks an existing game thread (suspend it, change its instruction pointer, resume it), there is no THREAD_ATTACH event and this function never fires for that thread.
The VEH Chain Dump
VAC_DumpVEHChain_msg163 at 0x180004A10 walks the VEH linked list and reports all registered handlers.
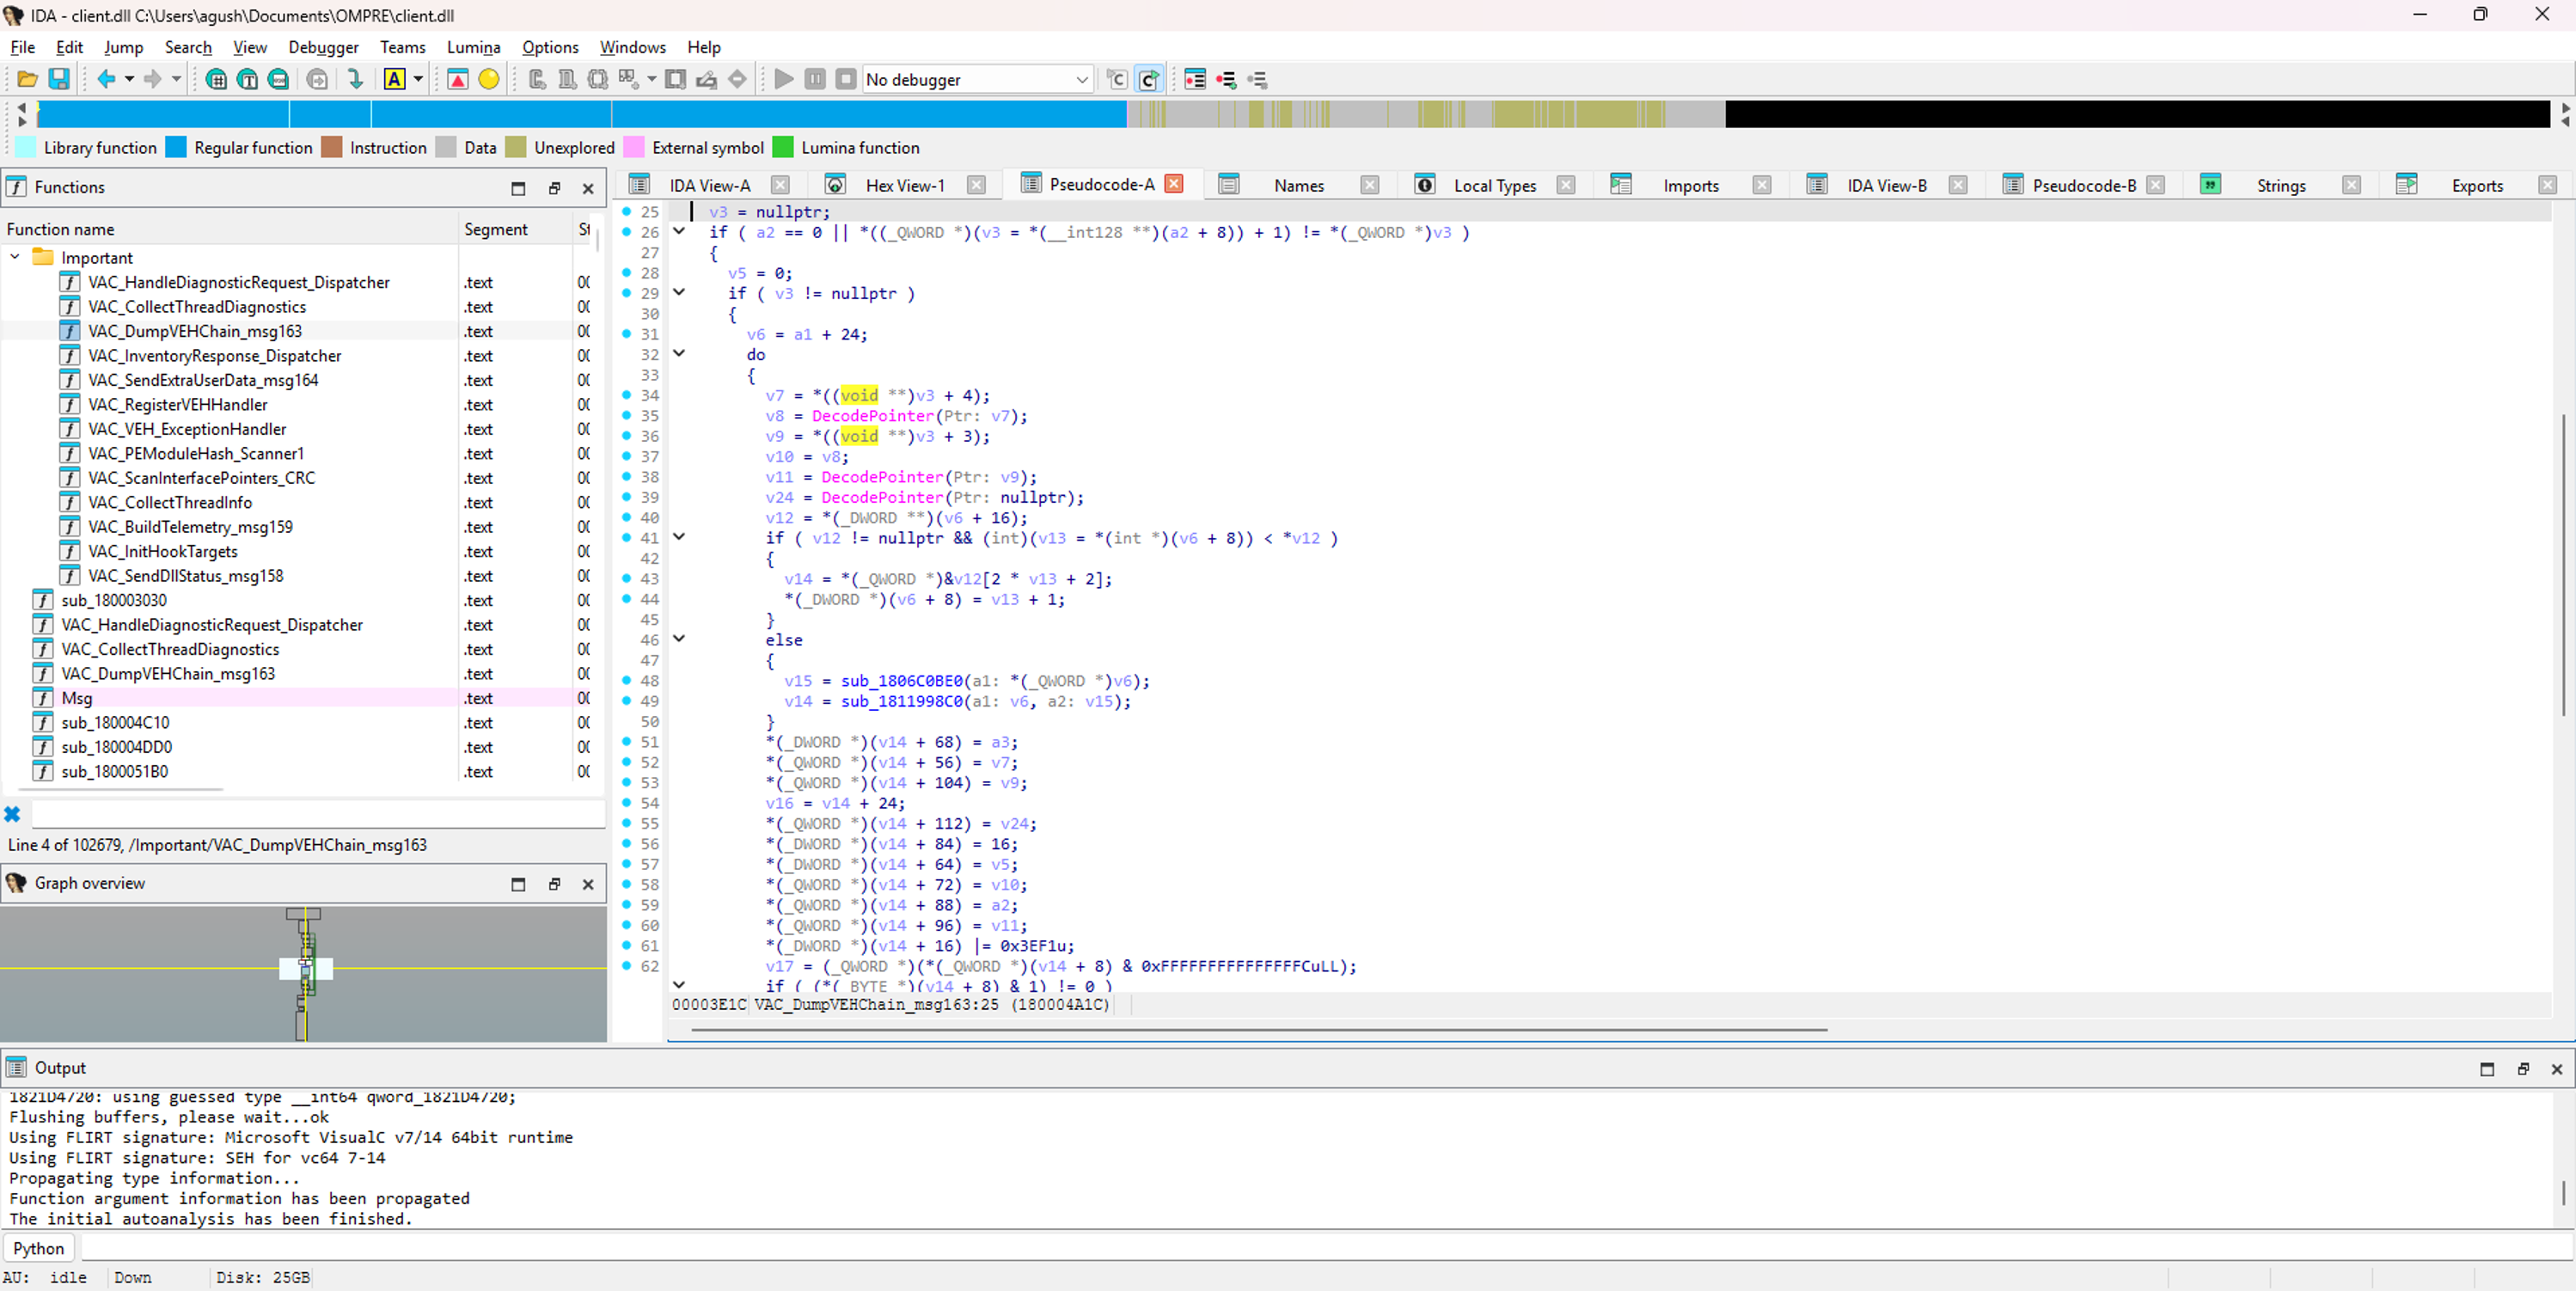
void VAC_DumpVEHChain_msg163(Context *ctx, void *vehList, int scanId)
{
    if (vehList == NULL || vehList->first->next == vehList->first)
        return;

    entry = vehList->first;
    index = 0;

    while (entry != NULL && index < 10)
    {
        handler = entry->handler;
        pfnHandler = DecodePointer(handler);
        pfnNULL = DecodePointer(NULL);

        result = ctx->AllocateEntry();
        result->scanId = scanId;
        result->rawHandler = handler;
        result->pfnHandler = pfnHandler;
        result->pfnNULL = pfnNULL;
        result->type = 16;
        result->index = index;
        result->vehListPtr = vehList;

        memcpy(alloc(48), entry, 40);

        entry = entry->next;
        index++;
    }
}
Why does VAC dump VEH handlers?
If a cheat registers its own VEH handler (for example, to catch exceptions for page guard hooks), its handler will appear in this list. The server receives:
- The raw handler address
- The decoded handler address (after
DecodePointer) - A copy of the full 40 byte VEH entry structure
If the handler address does not belong to any known loaded module, the server can flag it. If the handler address points to an unexpected location within a known module (like a code cave in gameoverlayrenderer64.dll), that might also be suspicious depending on server side analysis.
DecodePointer is a Windows API that reverses pointer encoding. Windows encodes certain runtime pointers with a random key to make them harder to predict. VAC decodes the handler address before reporting it so the server sees the real function address.
The Message Protocol Summary
| Msg | Direction | Content | When |
|---|---|---|---|
| 158 | C to S | Module tree CRC32 (two passes) + name/path entries for every loaded DLL | Once at connect |
| 159 | C to S | 40+ fields: full DLL list, PE timestamps, IsDebuggerPresent, CPUID, command line, BSecureAllowed | Once at connect |
| 161 | C to S | PE hashes (Scanner 1) + engine VMT frequency map (Scanner 2) + 112 interface CRCs (Scanner 3) | 4x batched |
| 162 | S to C | Server commands: Cases 23, 26, 27, 28, 29, 30 | On demand |
| 163 | C to S | DR registers + VEH chain (up to 10 handlers) + exception ring buffer (64 entries with stack dumps) | Every ~5 seconds + on demand |
| 164 | C to S | Field monitor events: unknown module return addresses, data hash mismatches | Per event |
| 385 | C to S | Counter strafe telemetry | Per input |
What I Learned
After spending time with the disassembly here is my summary.
VAC is a data collector not a defender. It does not block anything in real time. It does not kick you mid game. It collects data and sends it to Valve servers for analysis. Bans are delayed in waves to prevent reverse engineering of detection methods.
The client side detection surface is narrow:
- 2 function prologues checked (NtOpenFile and LoadLibraryExW), 8 bytes each
- 1 vtable entry in the CRC (vtable[0] only)
- .data sections excluded from PE hashing
- Thread scanning only for THREAD_ATTACH events
- No cross process visibility
- No kernel visibility
The server side capability is broad:
- Read any memory up to 1024 bytes per request
- Probe any exported function in any loaded DLL
- Call any CFG valid function in the process
- Dump any thread debug registers
- Reset the exception ring buffer on demand
- Plant function pointers for later execution
VAC is entirely user mode. There is no kernel driver. This is the fundamental architectural limitation. It cannot register ObRegisterCallbacks to filter handle creation. It cannot see cross process activity. It cannot detect hardware level reads like DMA. It cannot see kernel level code.
This is by design. Valve chooses to run VAC in user mode probably because a kernel driver would be harder to maintain across the wide variety of hardware and Windows configurations that Steam runs on. But it means VAC has inherent blind spots.
The most powerful part of VAC is the server directed diagnostics. When Valve discovers a new cheat they can push a server update that reads the cheat memory (Case 28) or probes its exports (Case 29) without updating the client DLL. This is why VAC uses delayed ban waves. It needs time to gather evidence server side before acting.
What I Did Not Check
I did not dynamic analysis. I did not run the game with a debugger. I did not capture network traffic between the client and Valve servers. I did not look at the steam.exe external scanner in detail. I did not reverse the Trusted Launch component inside cs2.exe.
Some things I am not sure about:
- Does the server compare verbatim vtable entries against expected values or just use the CRC
- How does the external scanner in steam.exe actually work
- What does the server side heuristic analysis look like
- Is the trusted launch enforced in practice or optional
- What exactly goes in the 100KB BSecureAllowed violation string
If I have time maybe I will look at these next. For now this is what I found.
Signature reference: Aspasia1337/cs2-vac-internals - used to locate functions, all decompilation and analysis is my own